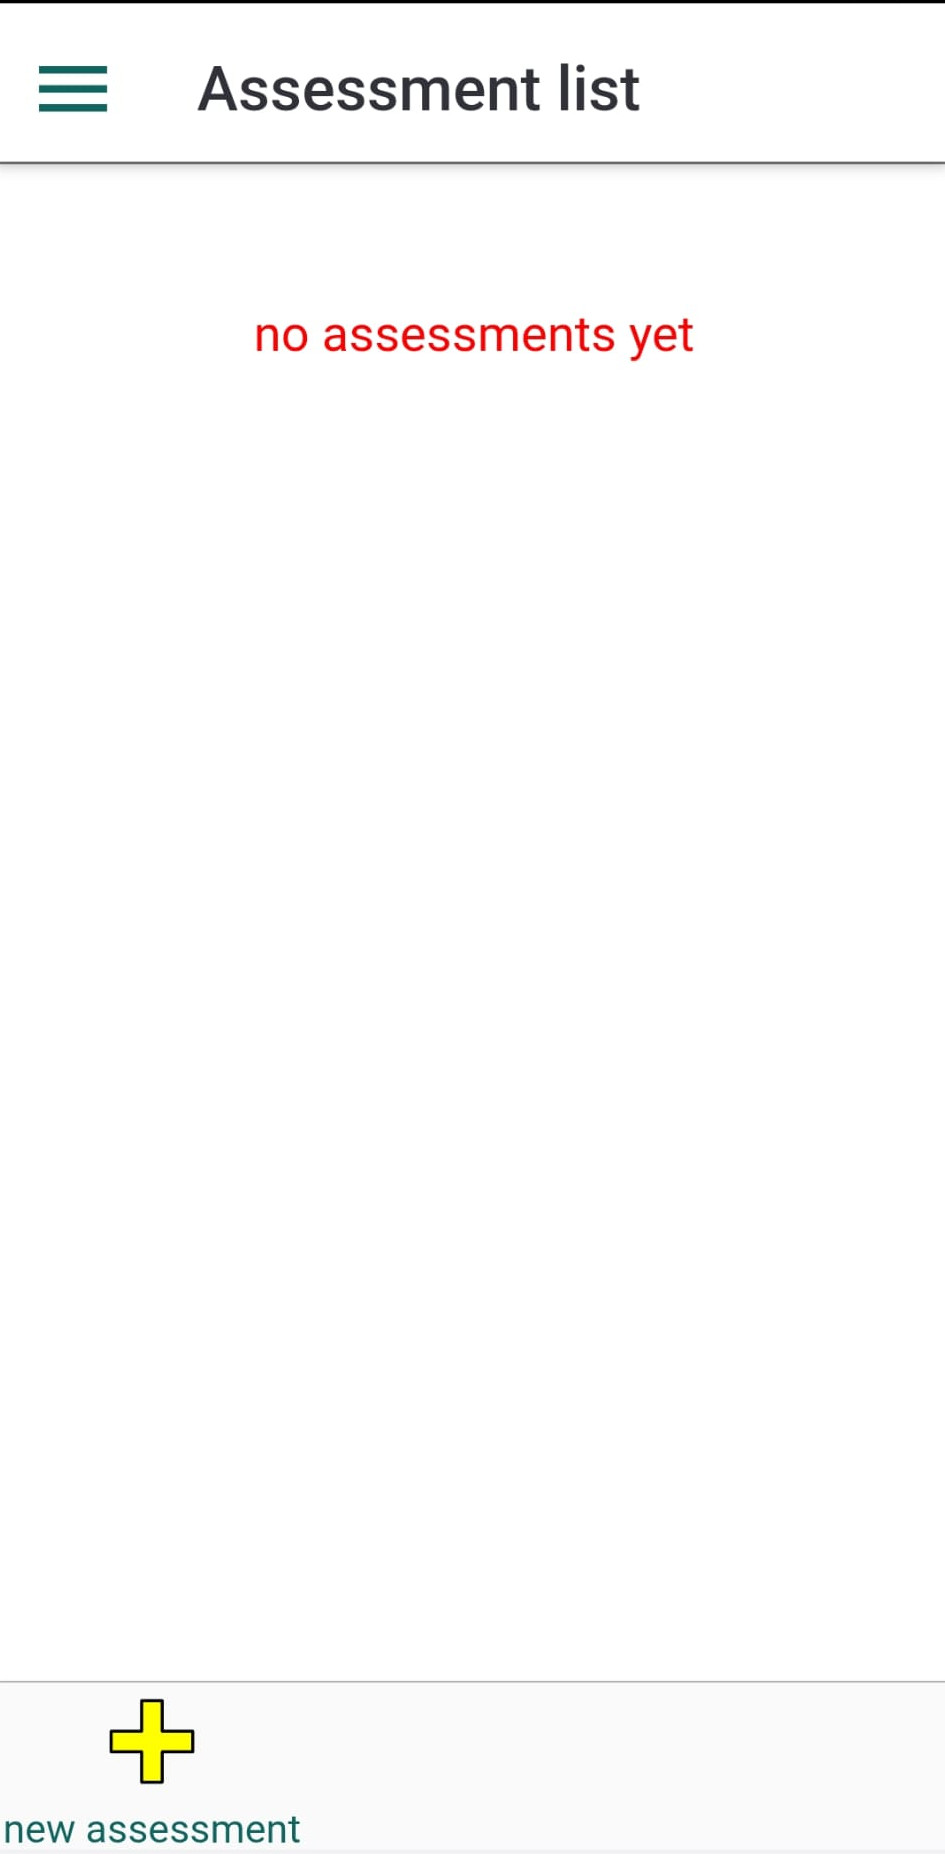
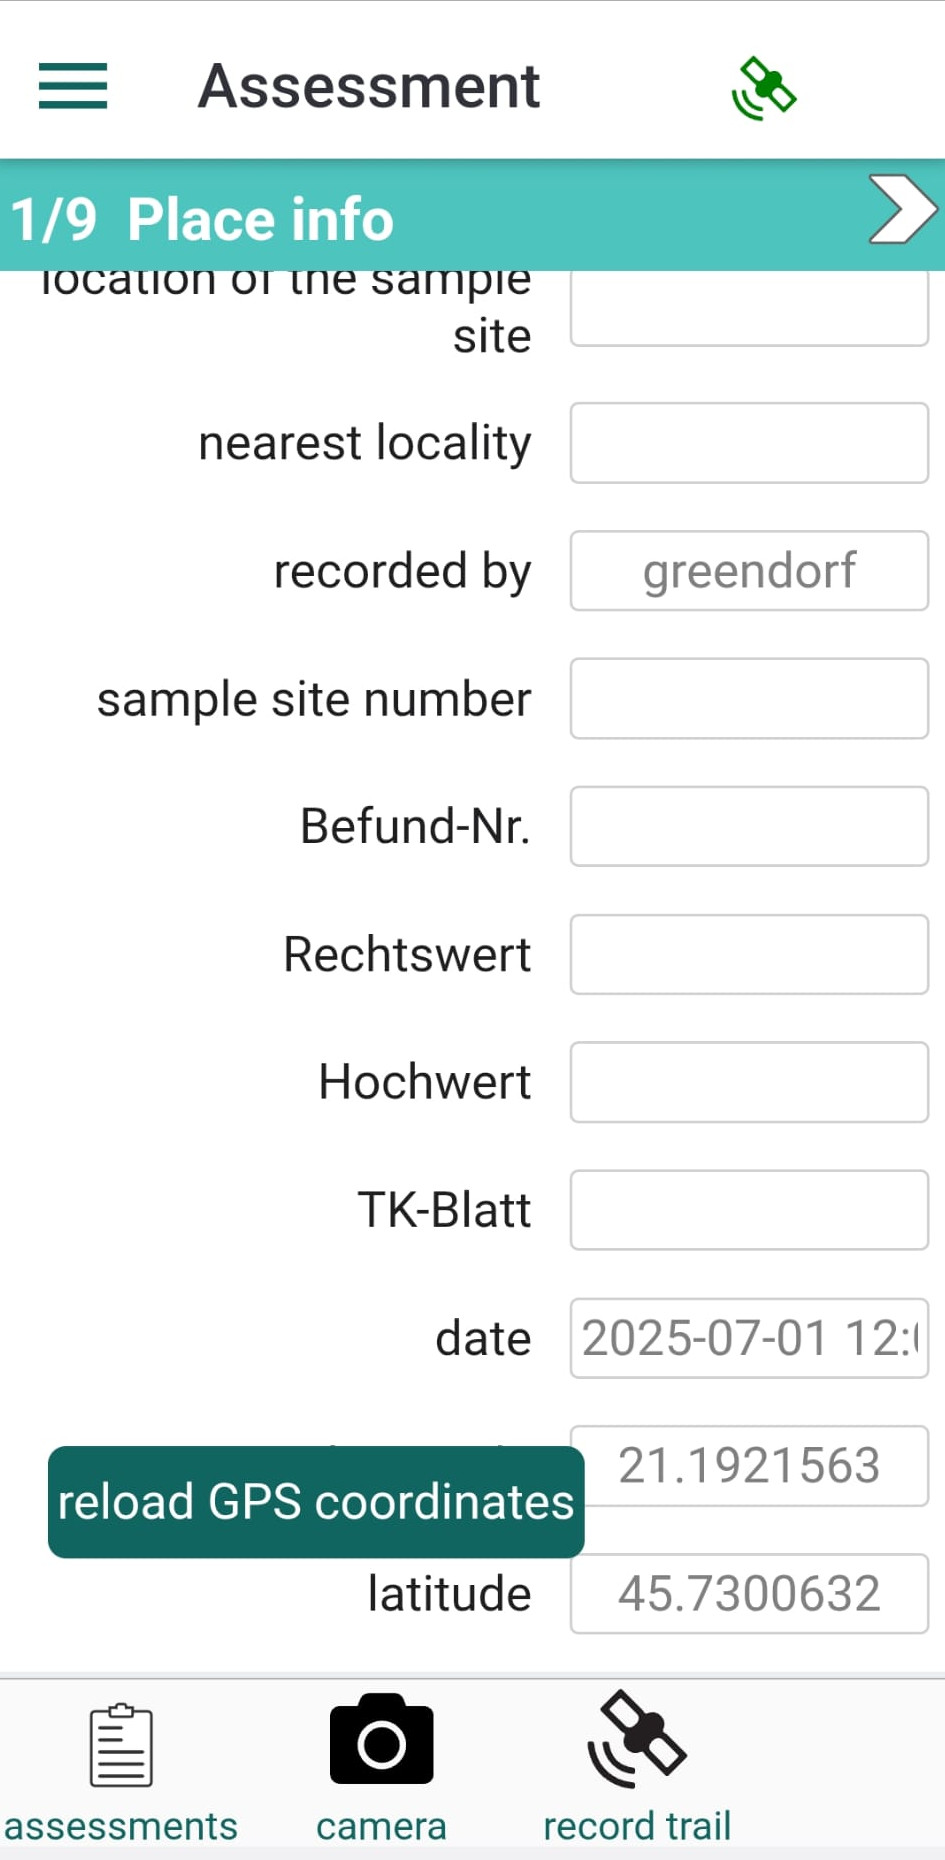
To create a new assessment, tap the menu item labeled "Assessments". In the panel that opens, tap the Add assessment button at the bottom of the screen — represented by a yellow plus icon. A new assessment entry will appear in the list, labeled “unnamed” followed by a timestamp. You can rename the assessment by editing the fields in the Place Info panel (1), which opens immediately after tapping the assessment name.
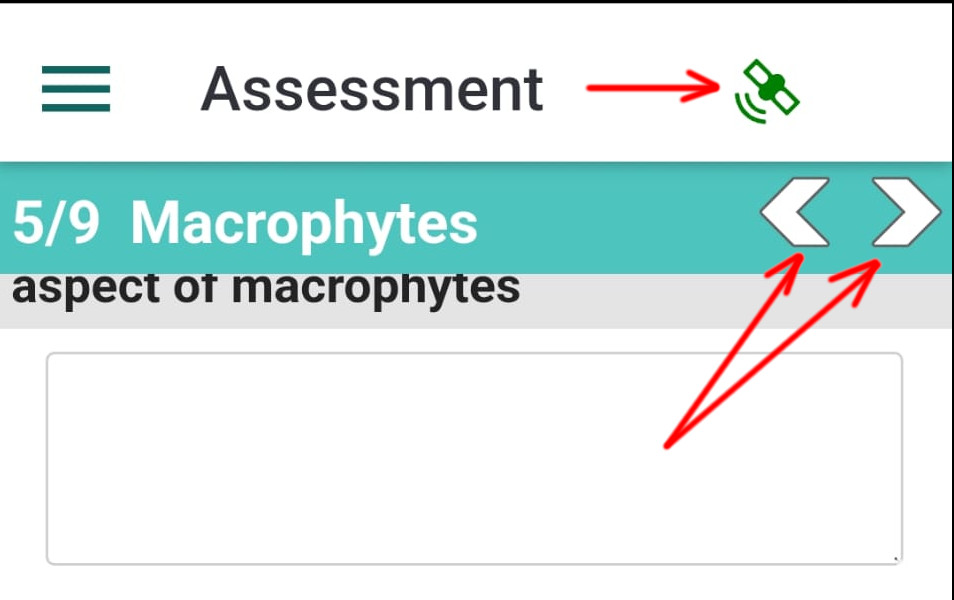
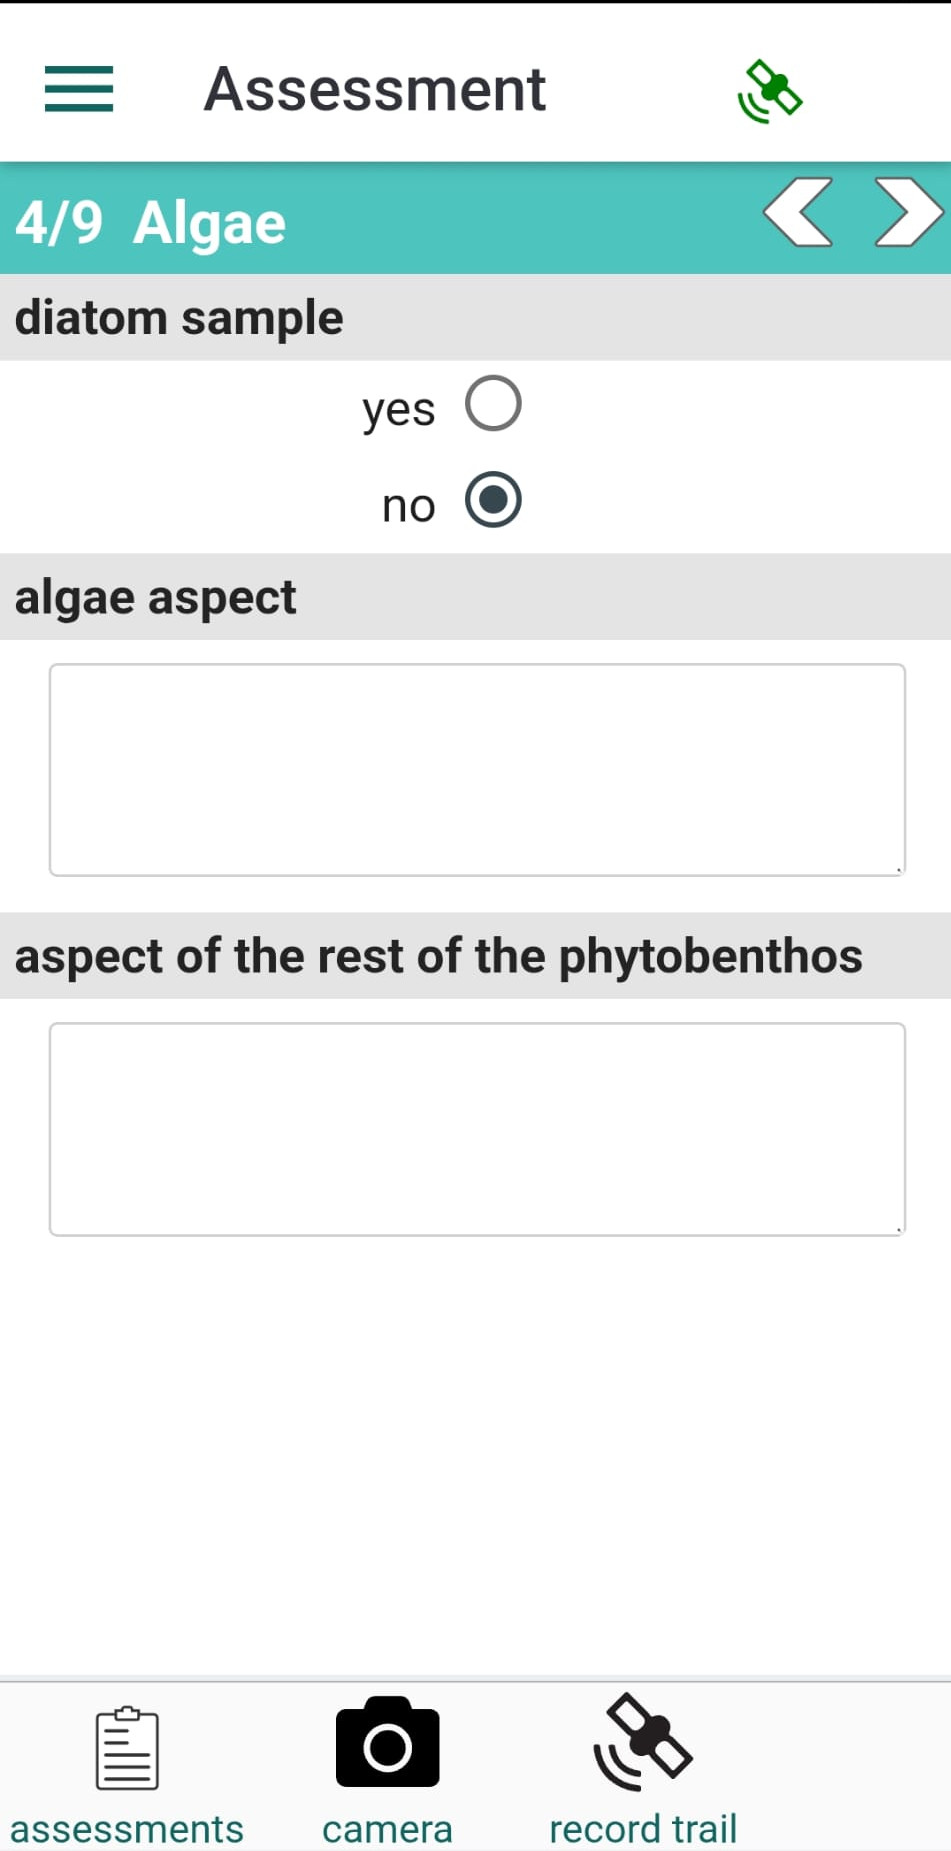
Assessment information is organized into nine panels. To navigate between panels, use the arrows in the subtitle bar. The green satellite icon in the title bar indicates the GPS status.
This panel contains fields for specifying the assessment location. Please leave unchanged your user name in the "recorded by" field.
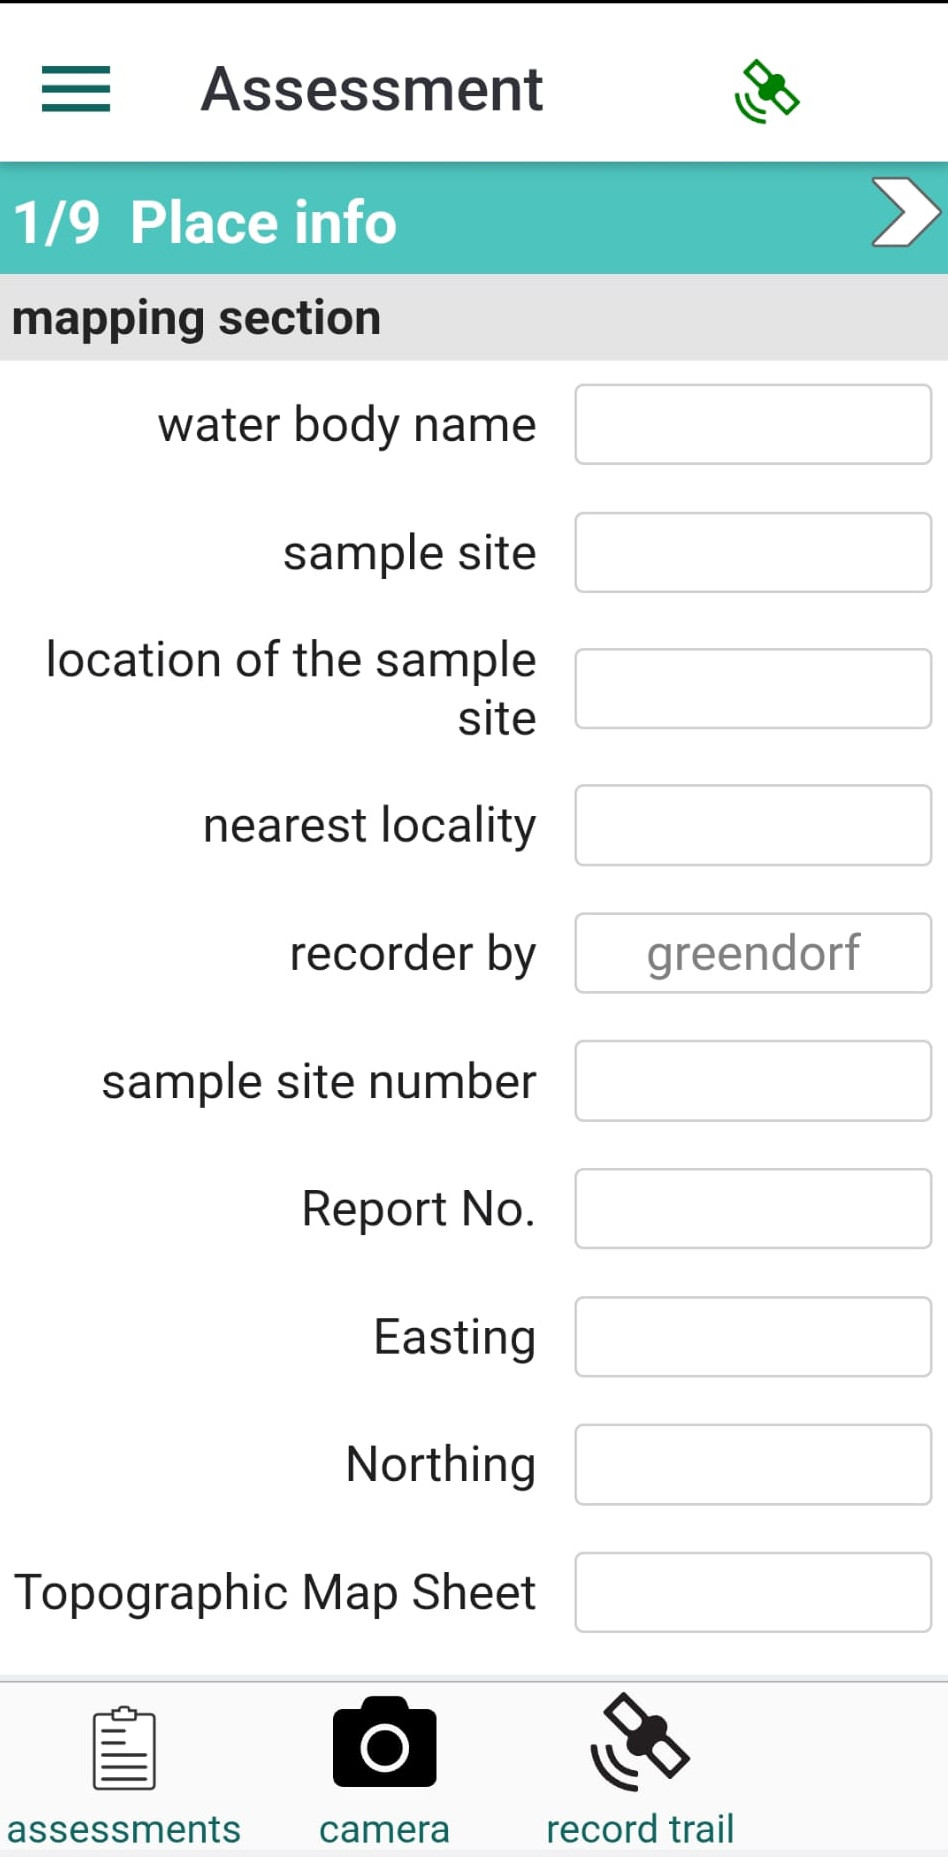
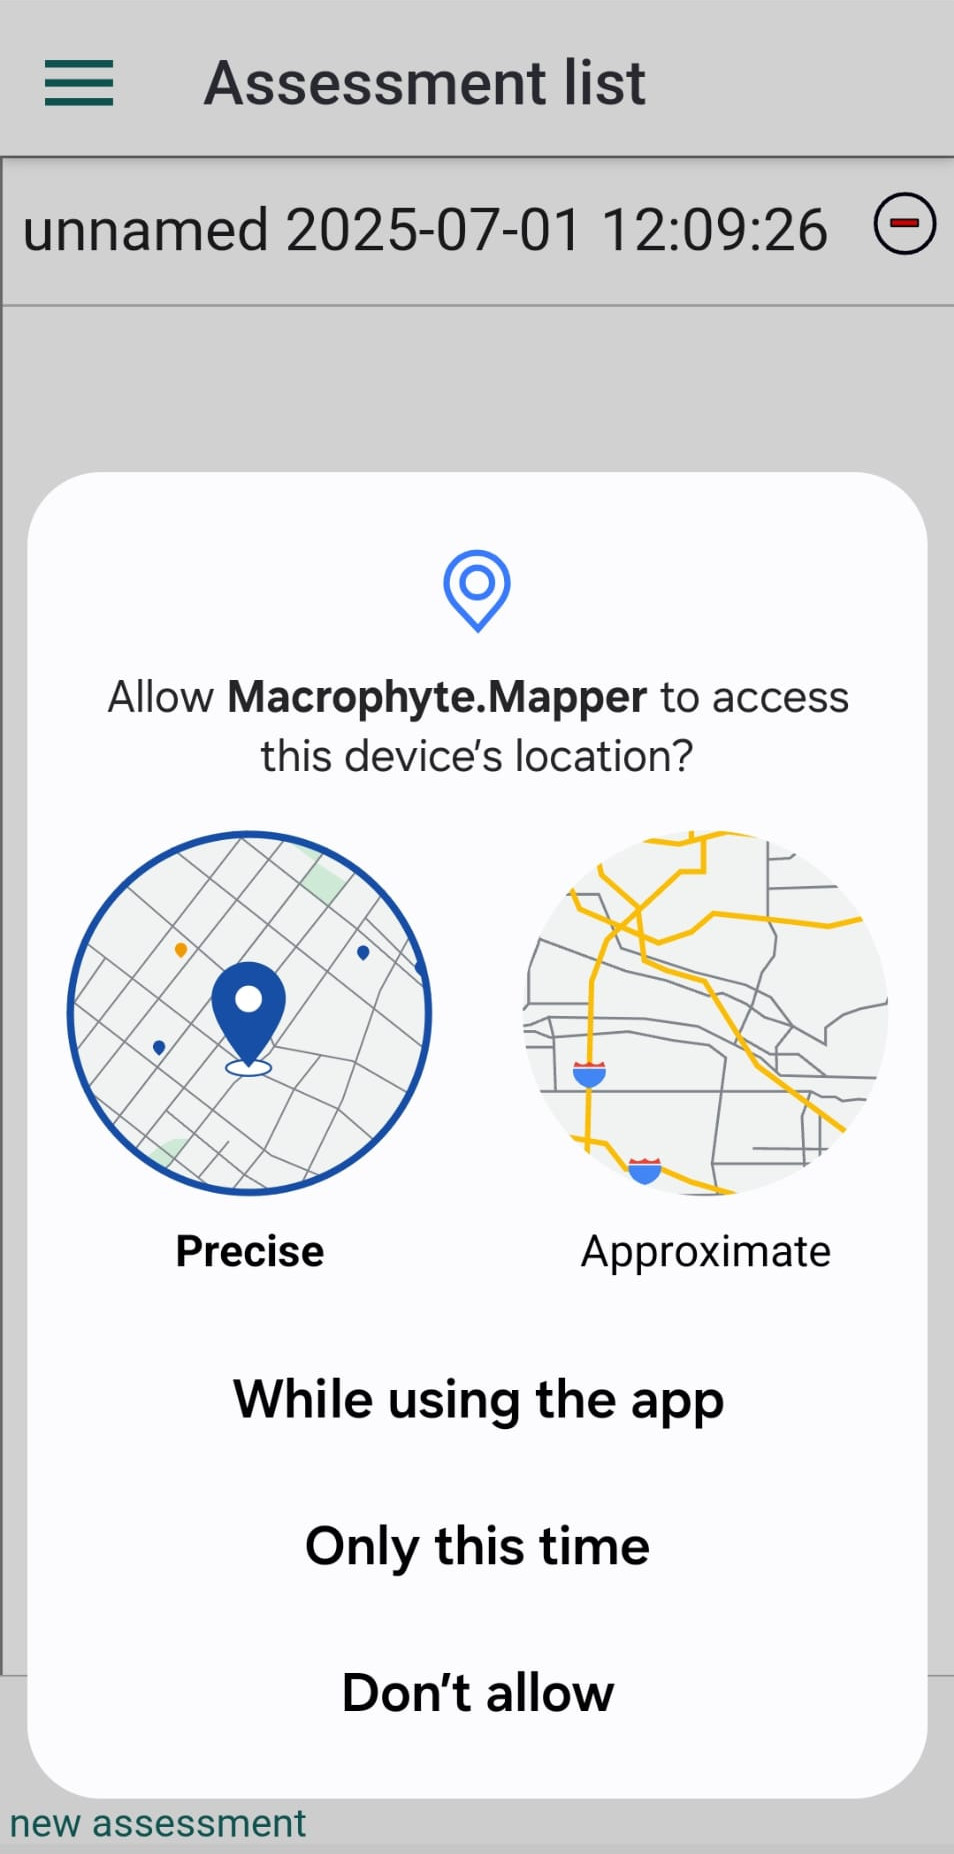
If your device’s GPS is turned on, you can set precise coordinates by tapping "reload GPS coordinates". The first time you use GPS functions, the app will request permission to access your location. On Android devices, please grant permission with the option "While using the app". If you make a mistake, you can change the permissions later in your device’s Settings.
The default coordinates (20/40) will be replaced with the precise GPS coordinates.
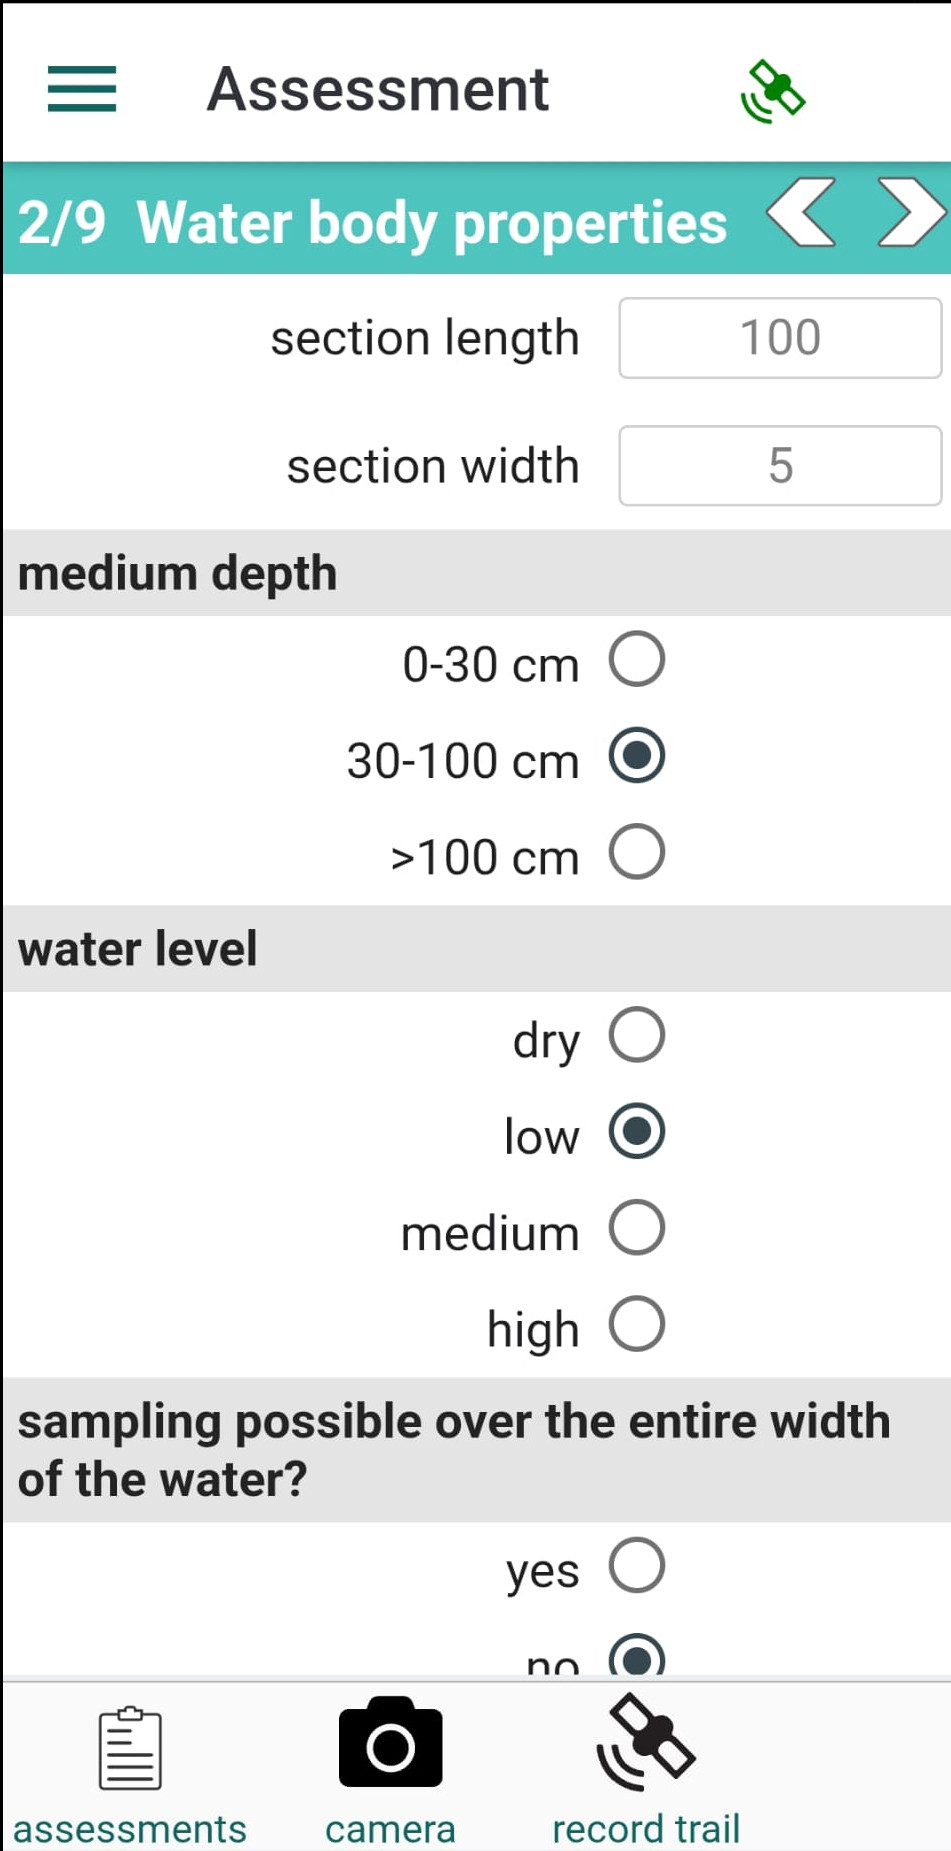
Panel 2 contains fields for recording water body dimensions, mean depth, water level, turbidity, and other water characteristics such as color, smell, pH, and temperature.
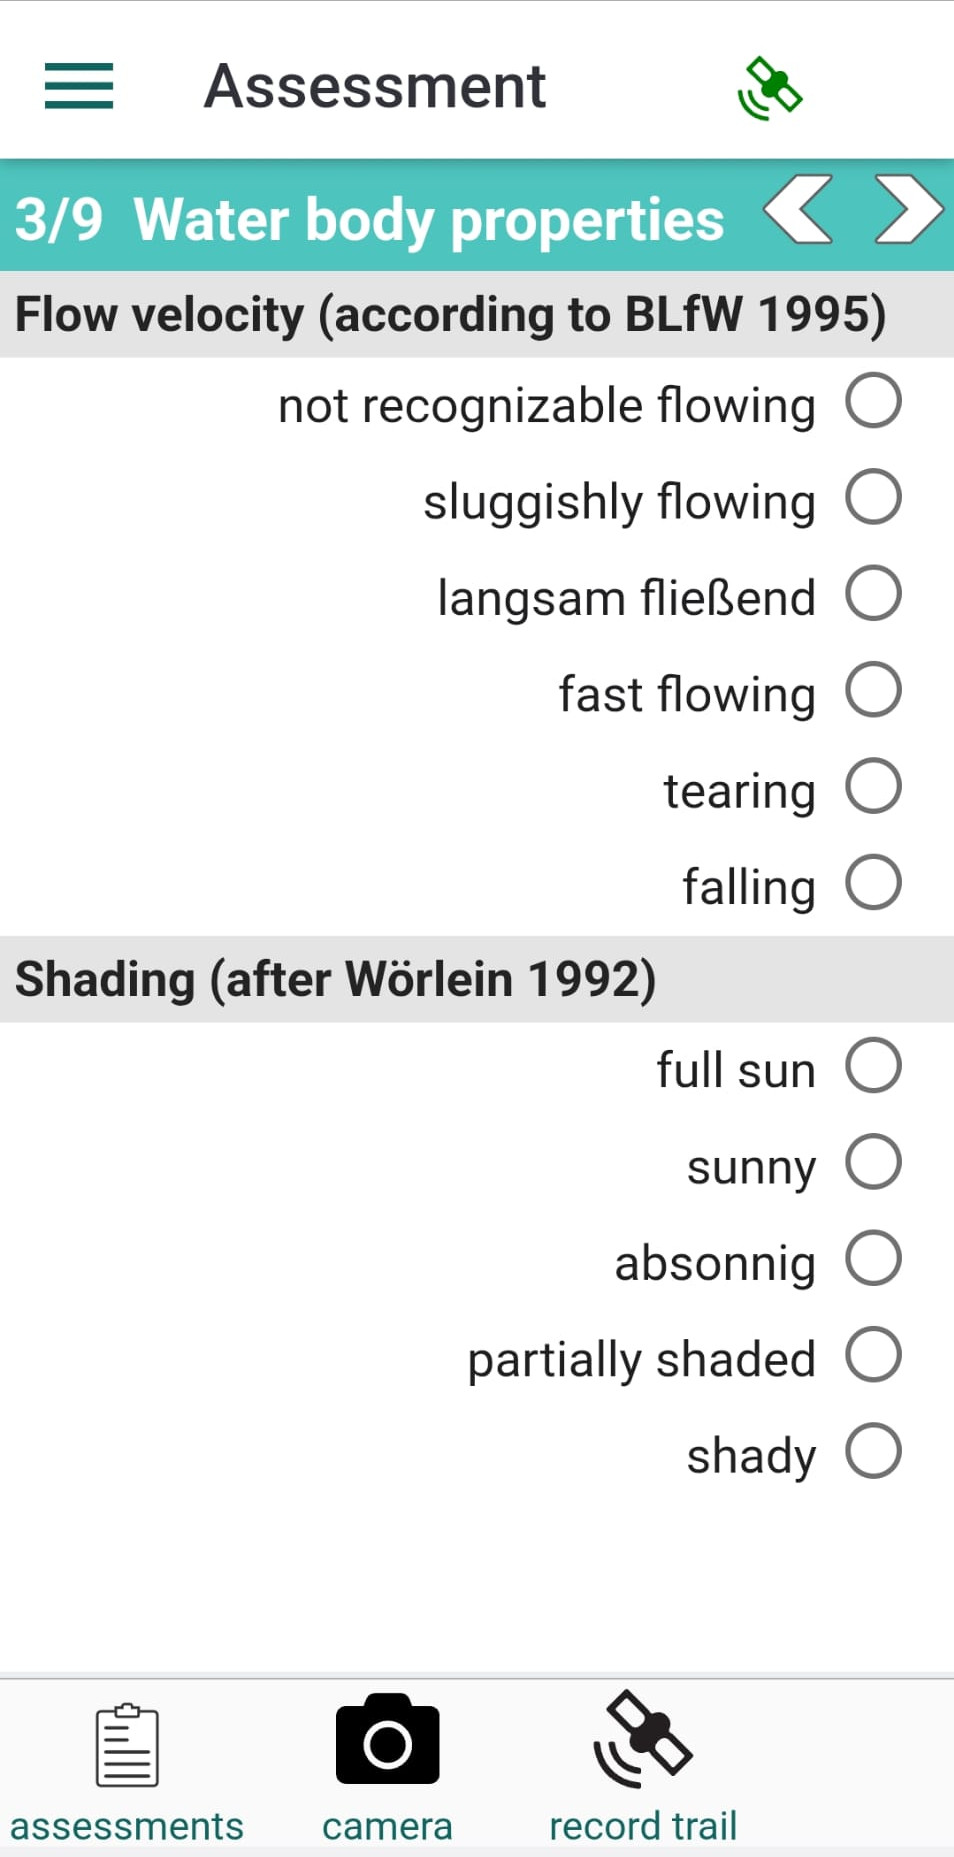
Panel 3 contains a form for specifying flow velocity (Bayerisches Landesamt für Wasserwirtschaft, 1995) and shading (Wörlein, 1992).
Panel 4 contains fields for recording information about algae.
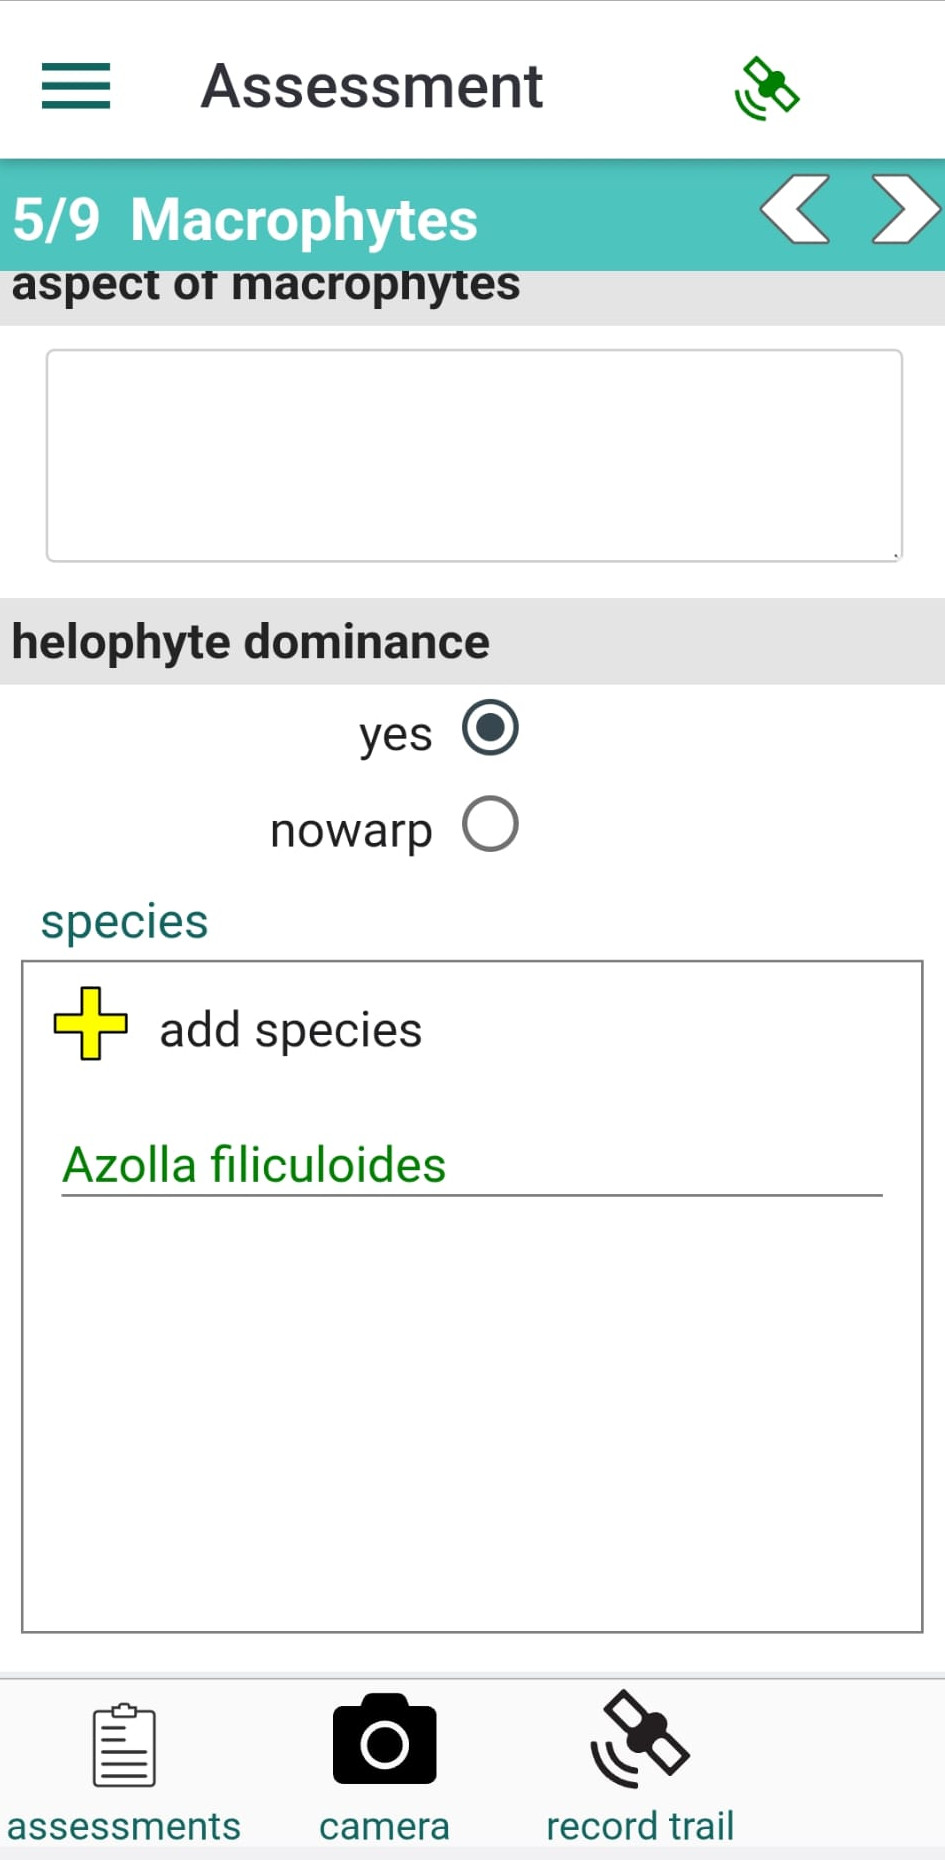
Panel 5 contains fields for recording macrophyte information: population type, obliteration, aspect, and helophyte dominance. If helophyte dominance is recorded, a list of observed species can be included. Please see the section on adding species.
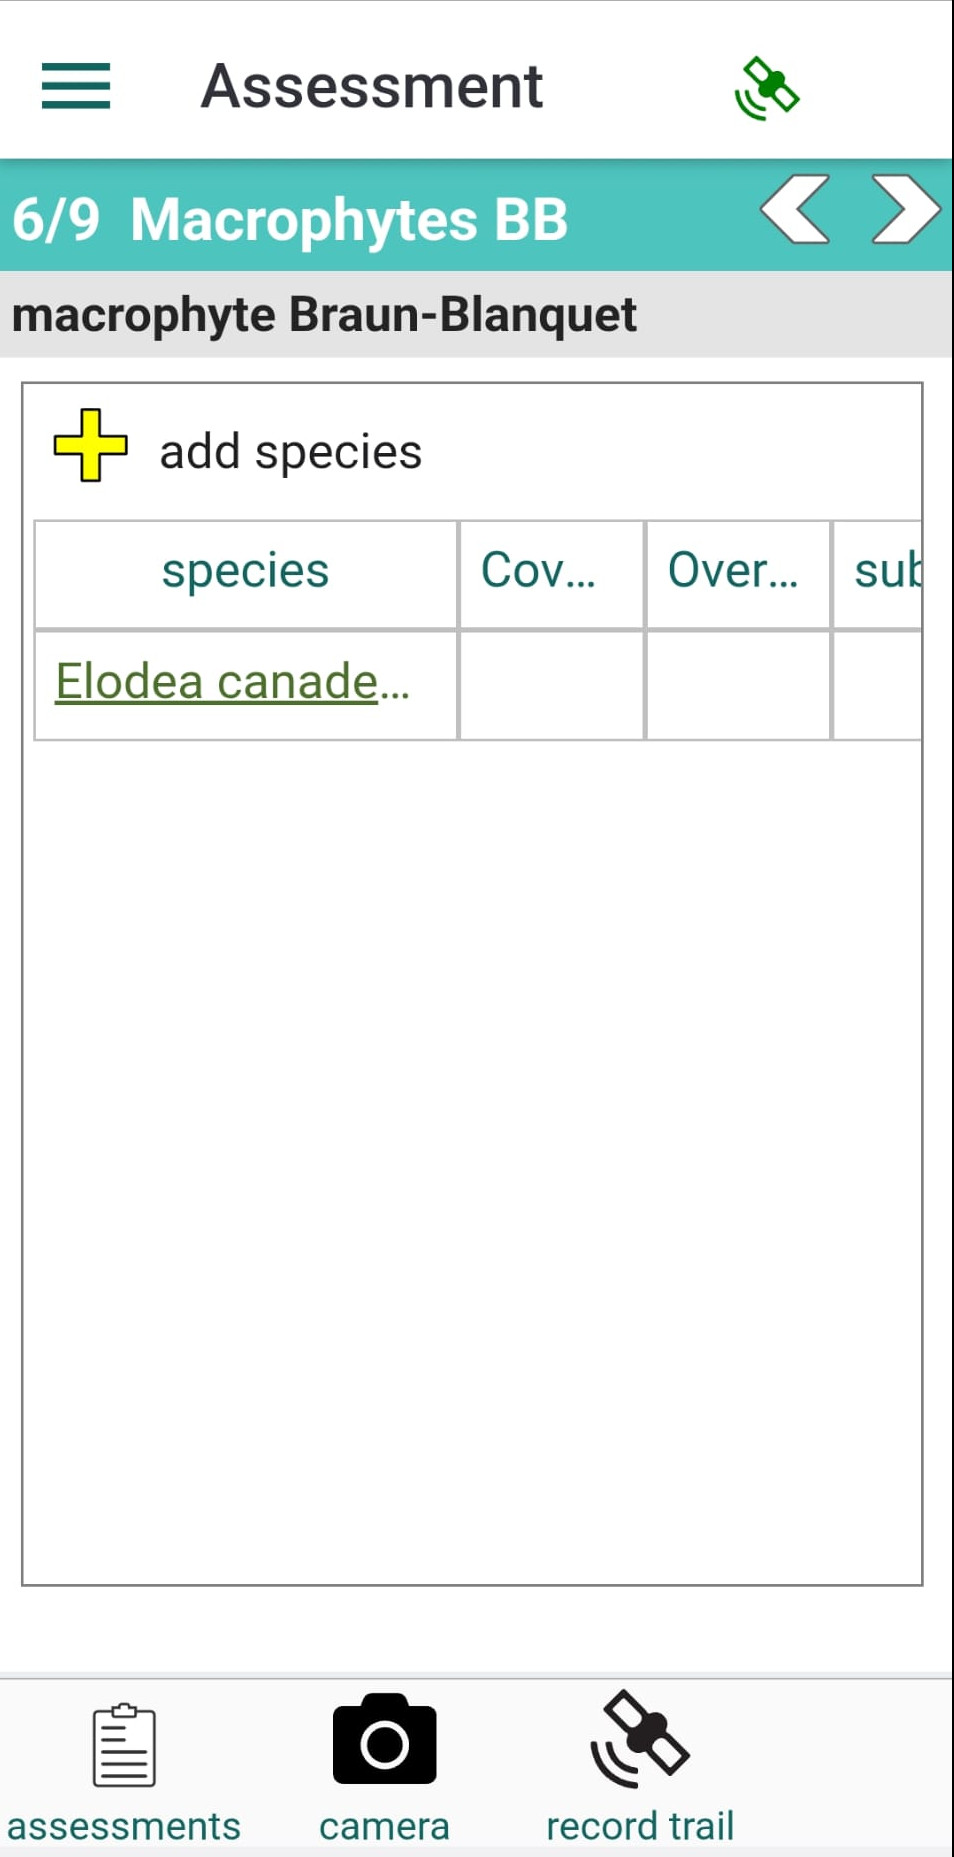
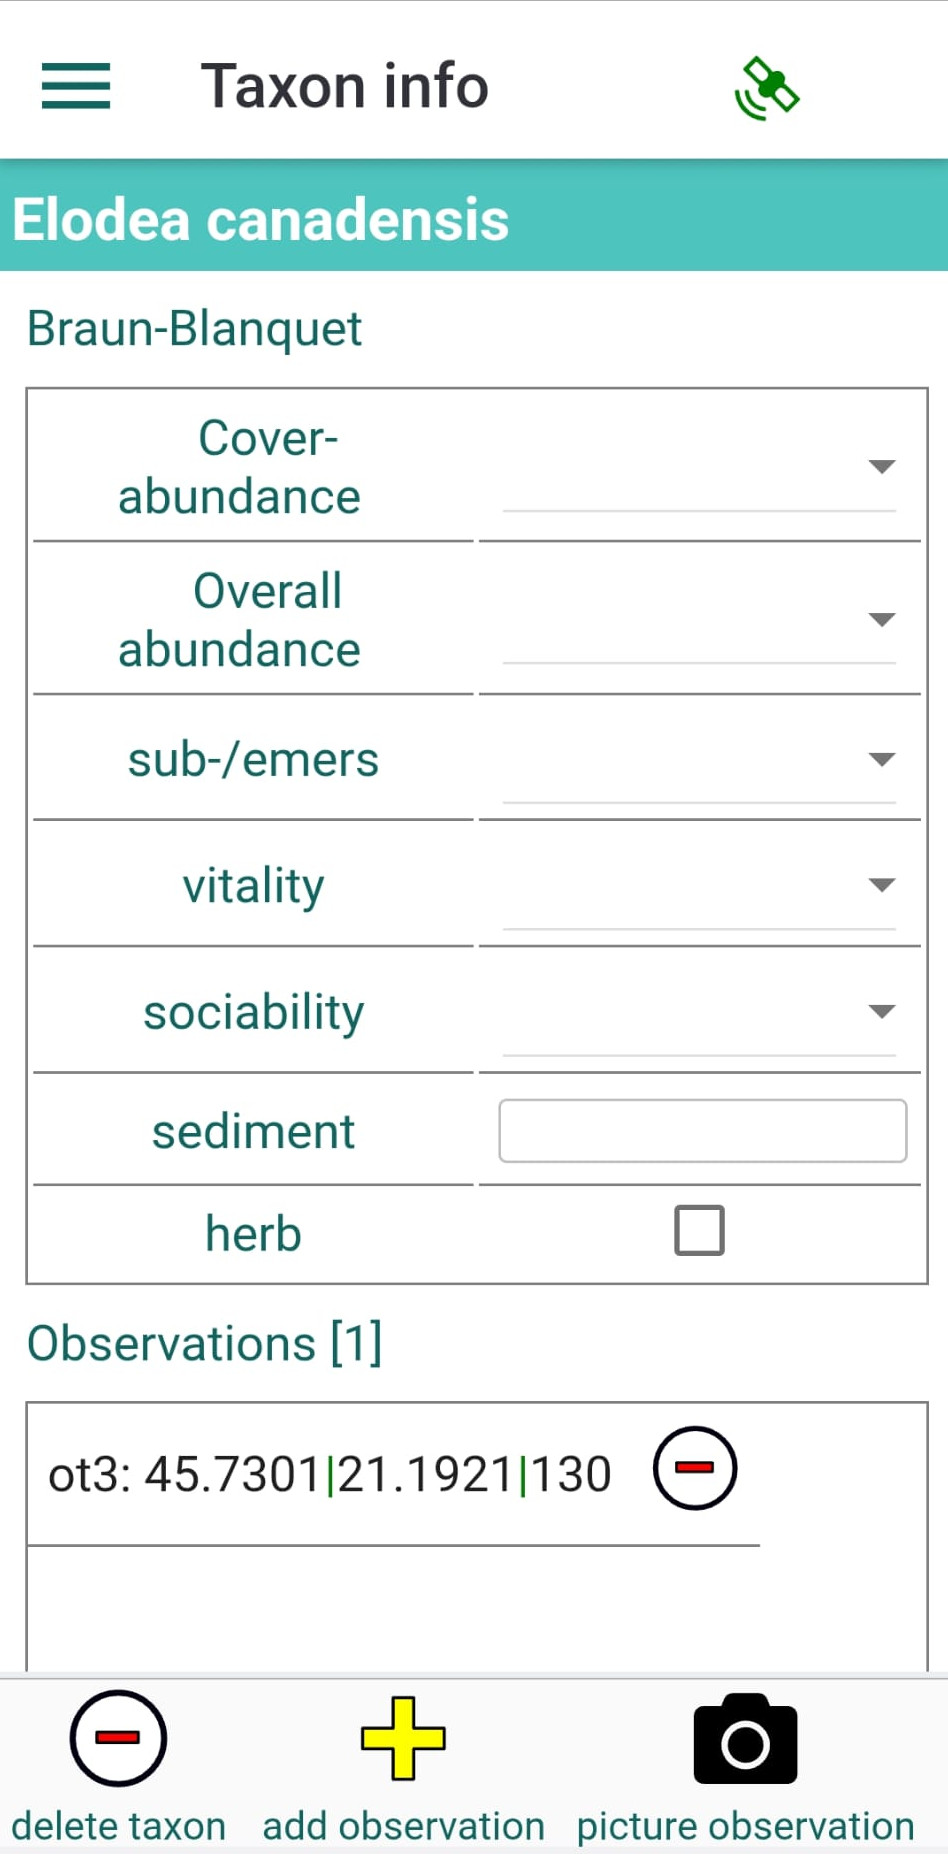
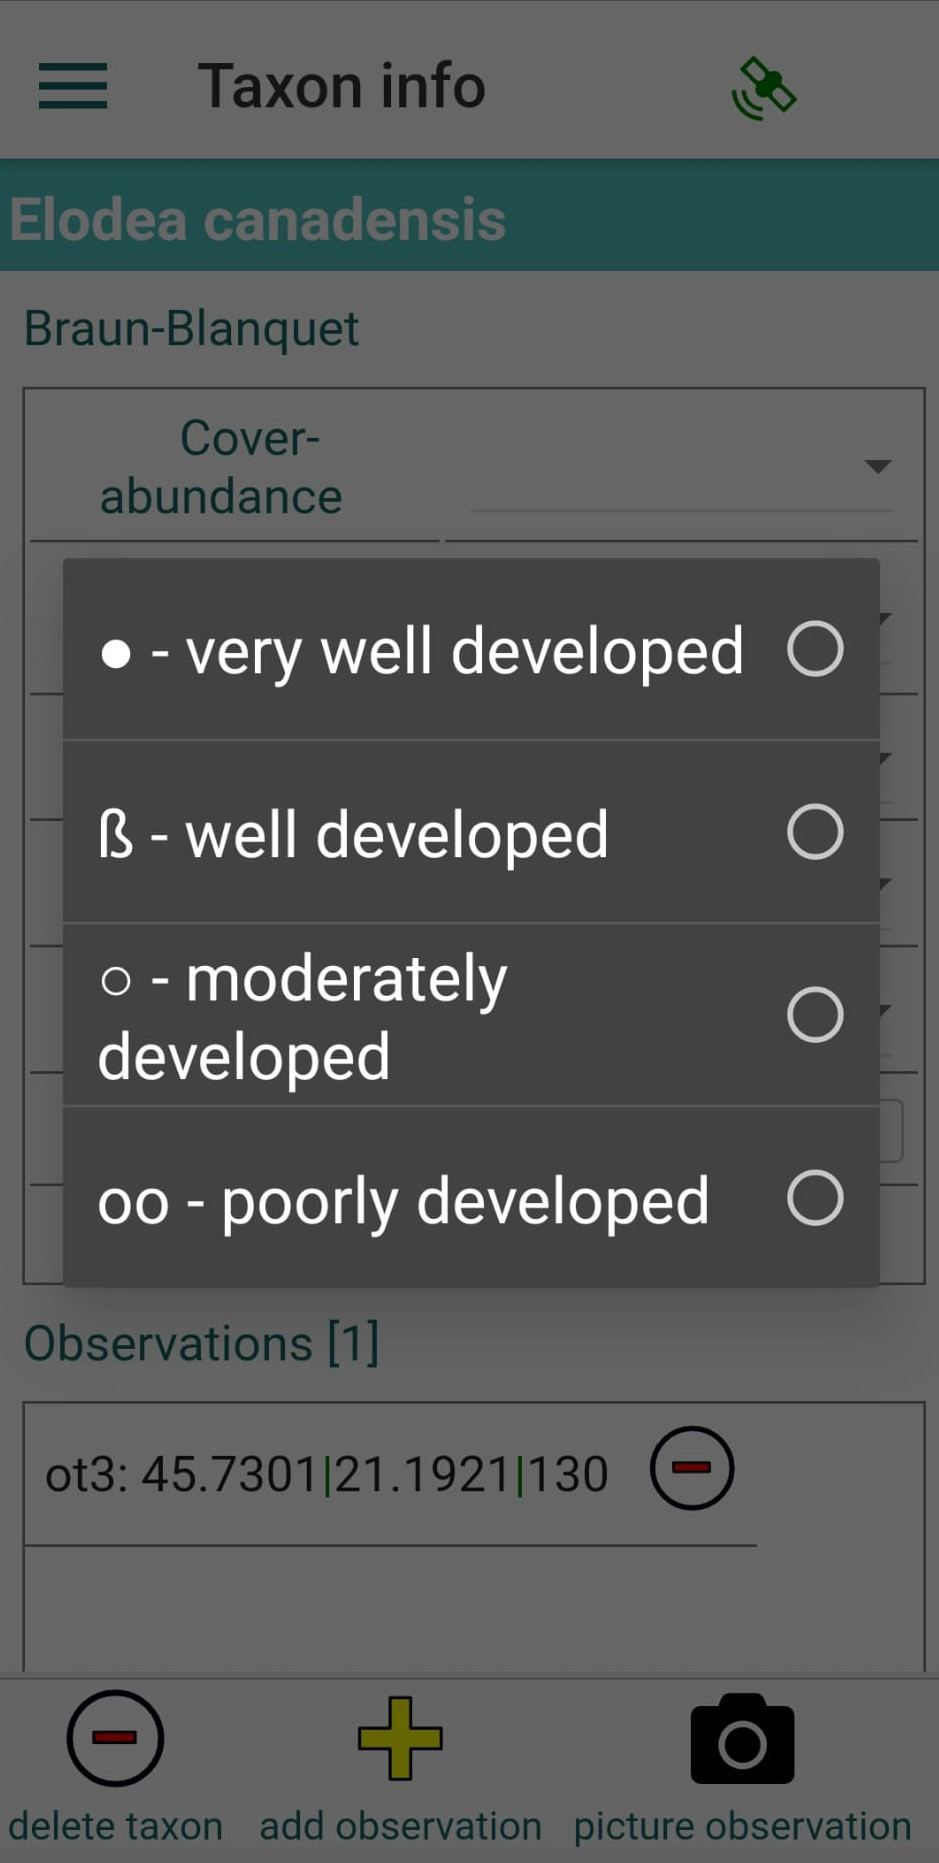
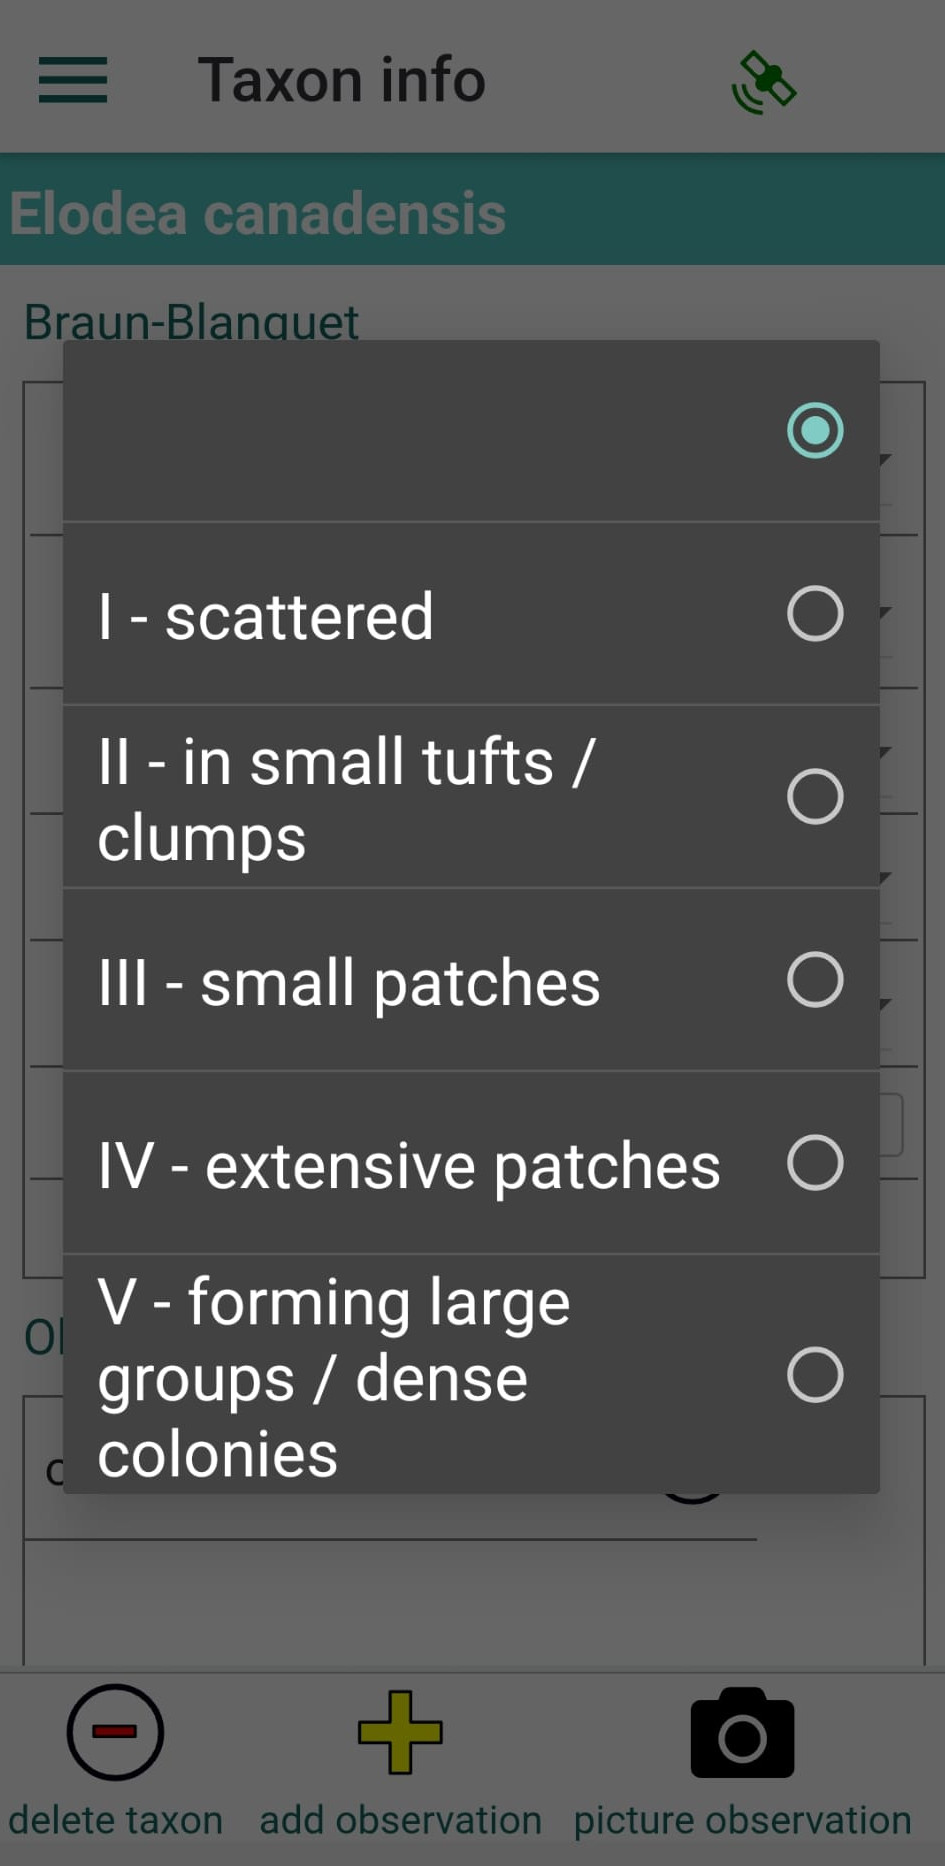
In Panel 6, you can build a Braun-Blanquet (BB) table. Add species to the table by tapping the "add species" button (more info here). For each species, you can record typical BB parameters: cover-abundance, overall abundance, vitality, and sociability. Additionally, you can record hydrophytic form, development stage, sediment type, and whether the species has been herbarised. To enter these parameters, tap the species name in the table and fill out the form. Please note that each species added to the BB table also creates an observation record. These observations can be imported into the Nature Digital Object Repository (@ https://kladia.info). Each observation automatically includes the species name, geographic coordinates, and date.
The BB form toolbar includes buttons for deleting species from the table (delete taxon), adding additional field observations of species, or adding species photographs (observations with images).
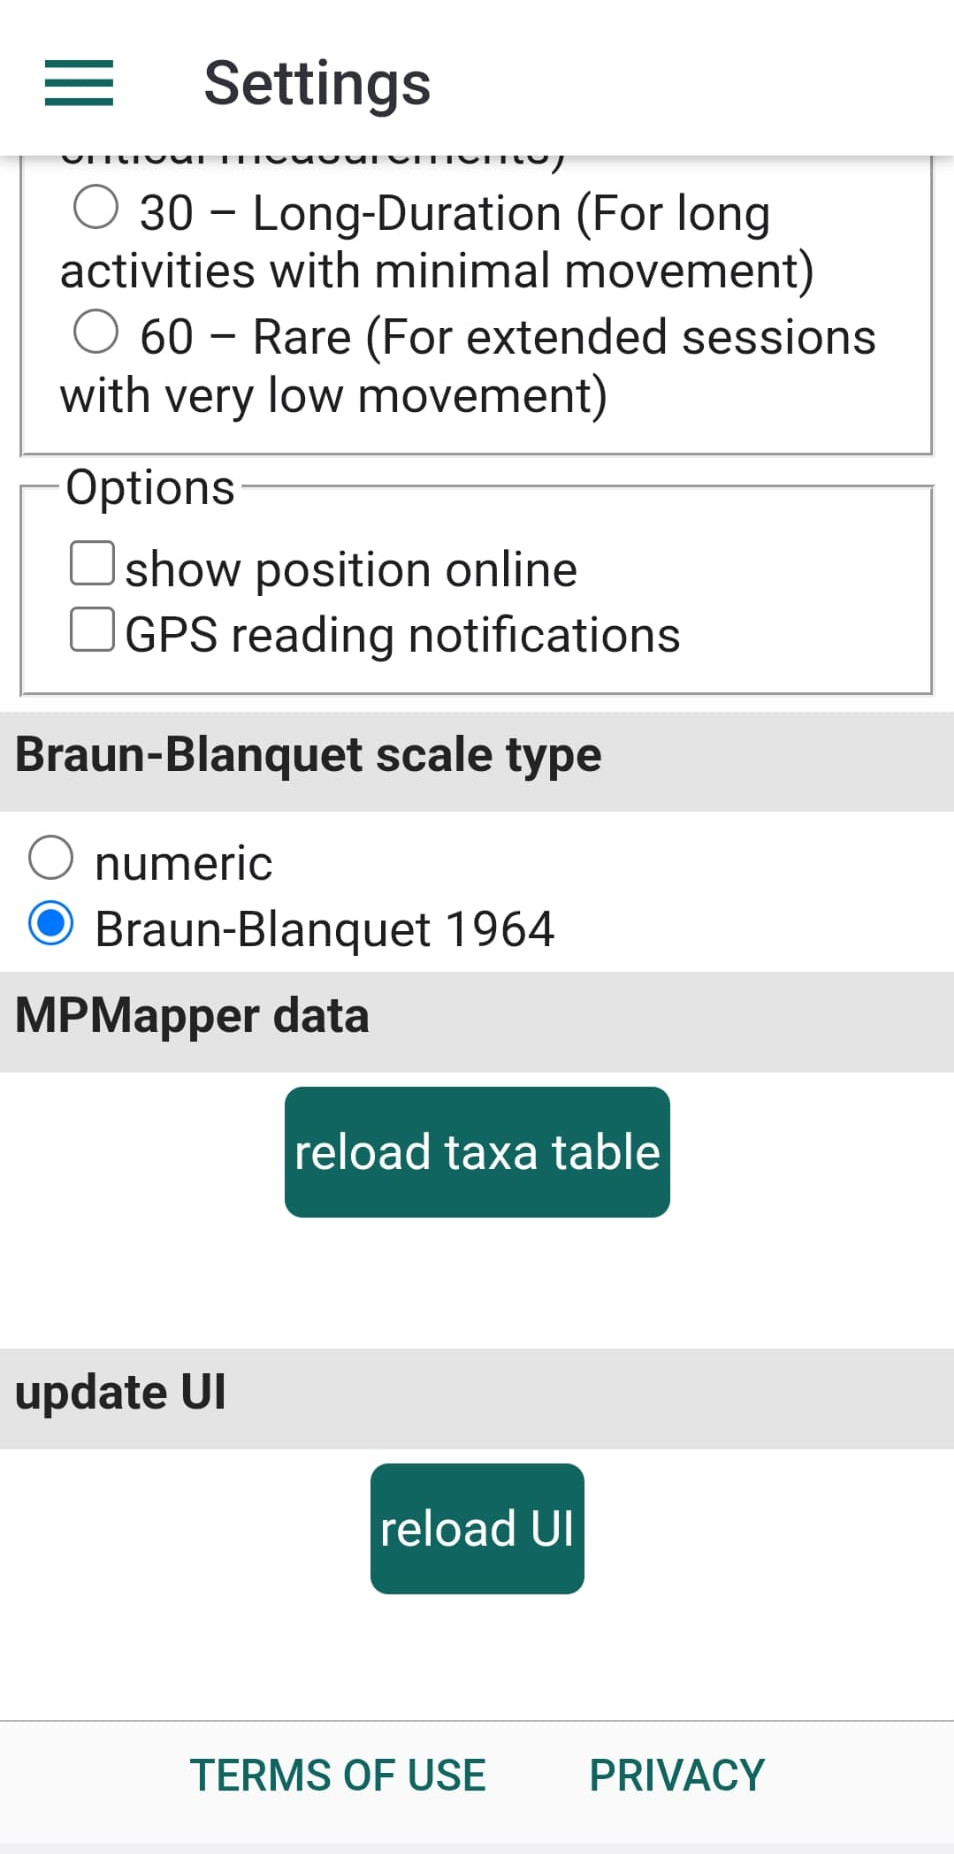
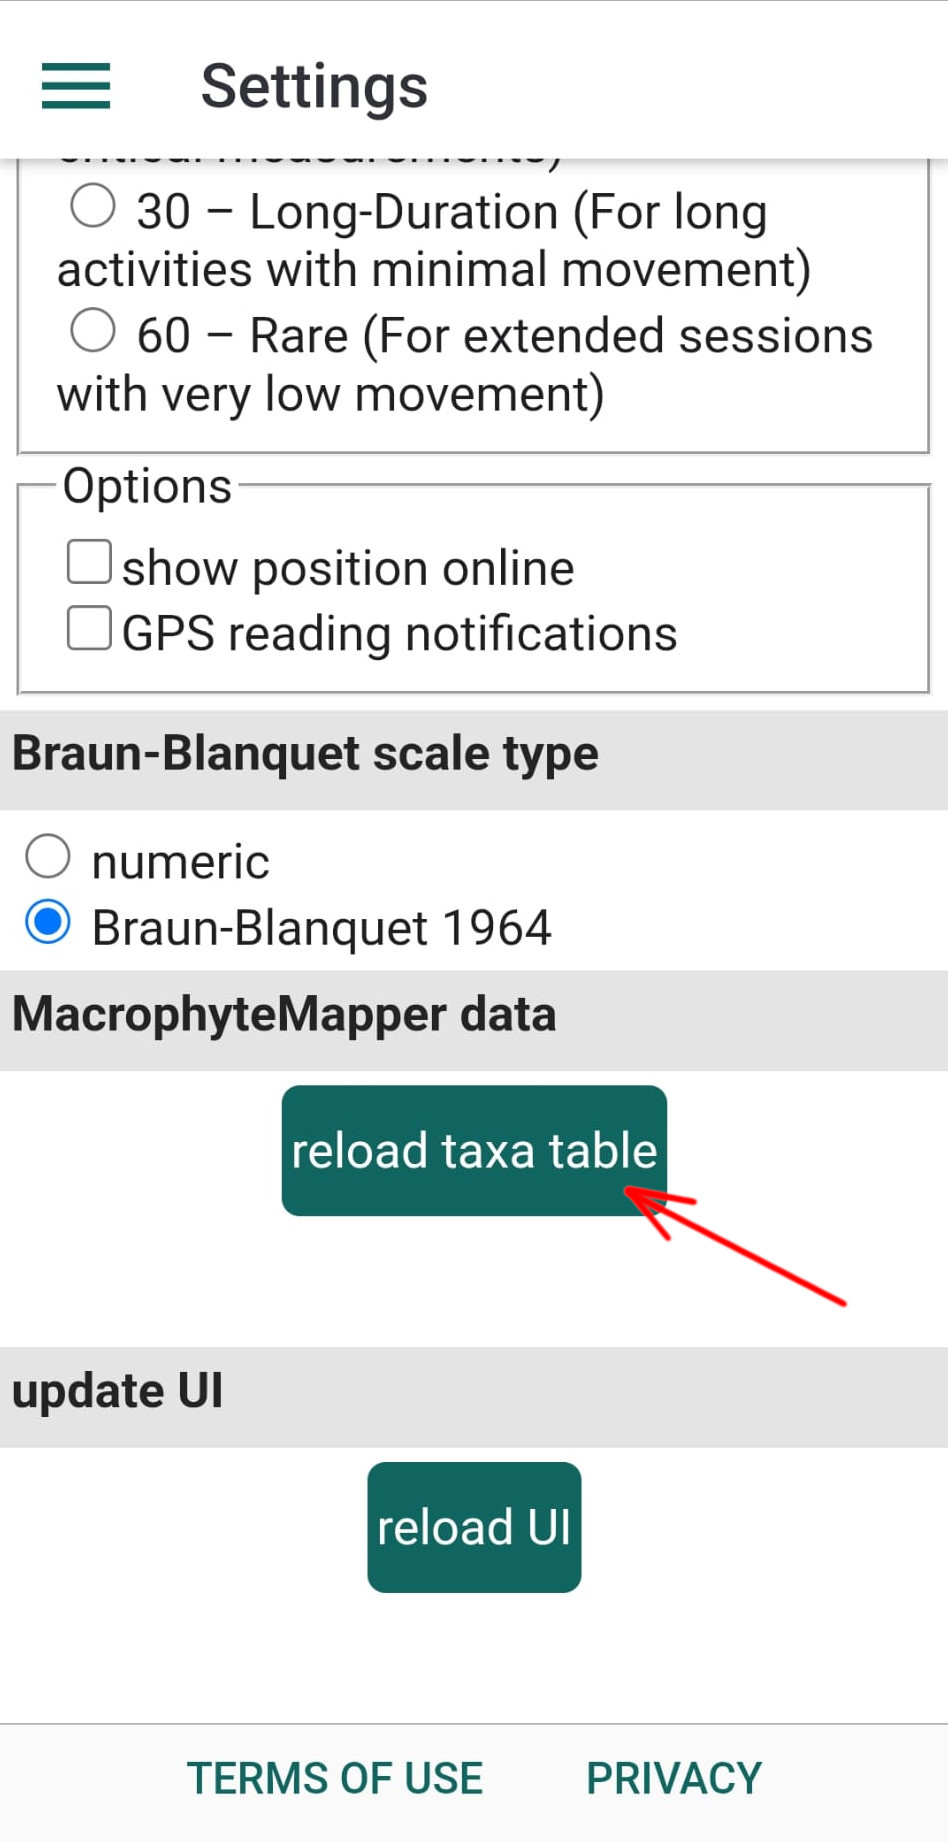
For vitality and sociability, MacrophyteMapper provides two scale types: numeric classes ranging from 1 to 5 (default) and the classic Braun-Blanquet (1964) classes.
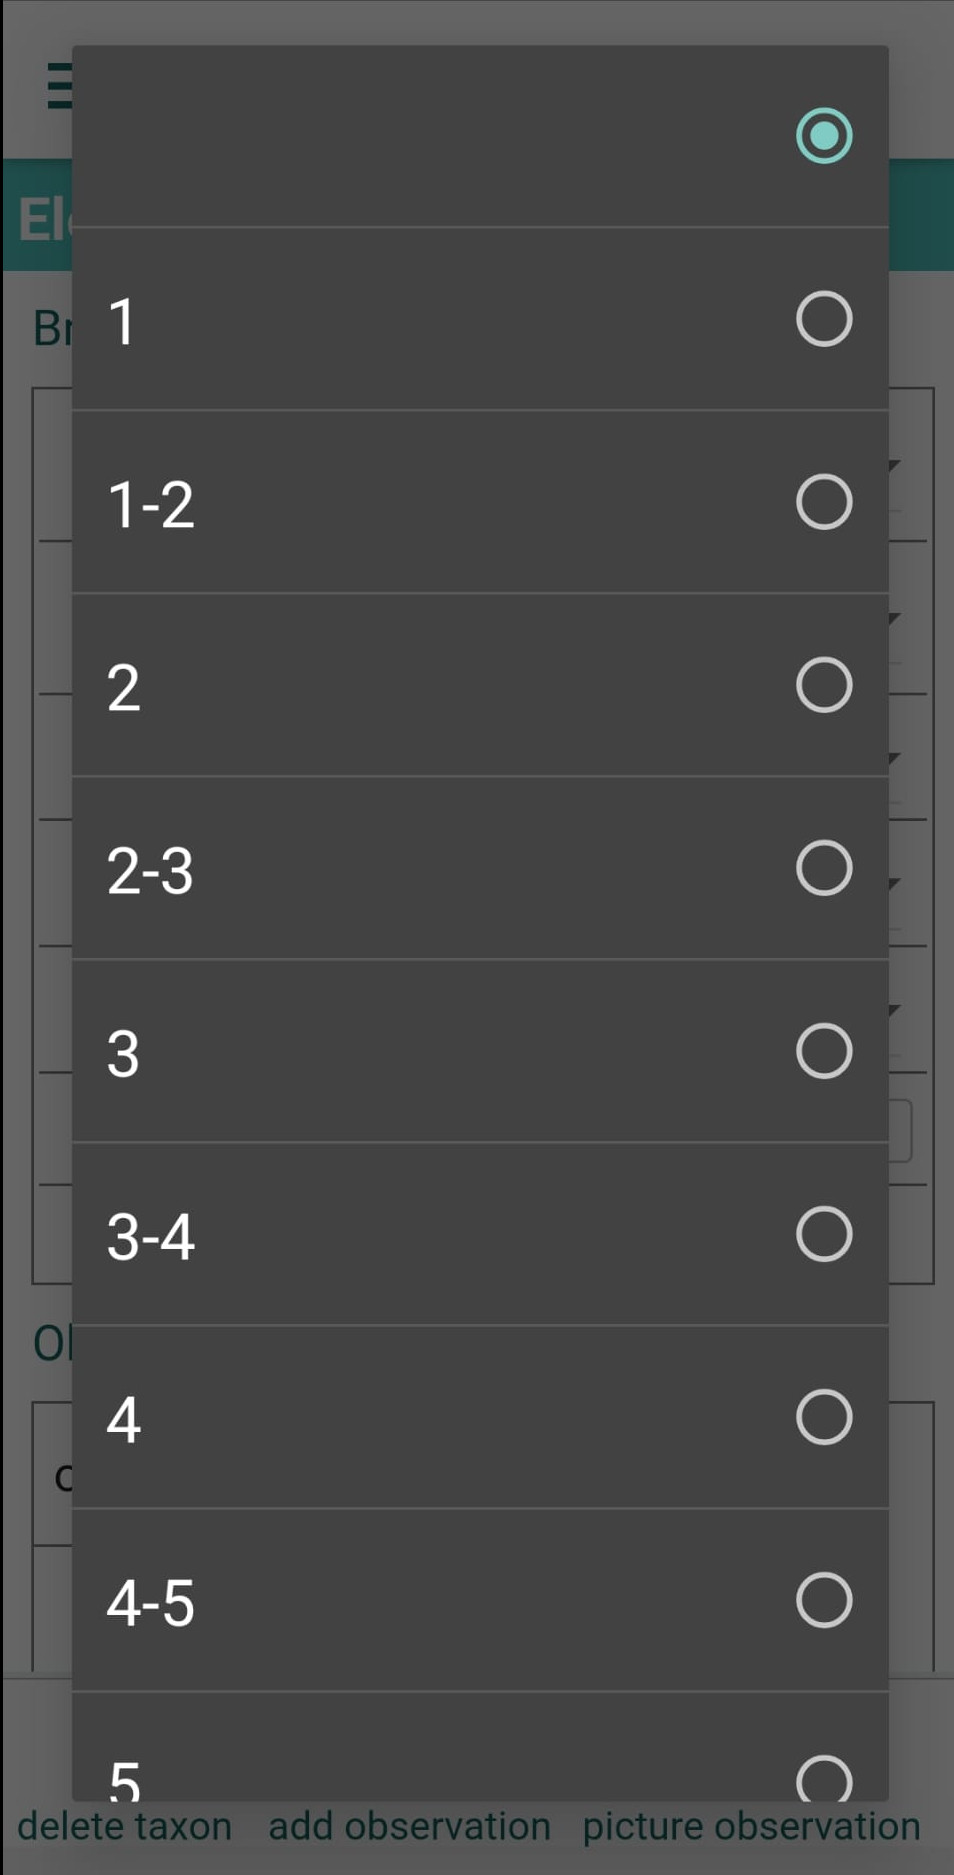
To change the scale type, go to the application’s Settings panel (see the app menu) and find the option for Braun-Blanquet scale type.
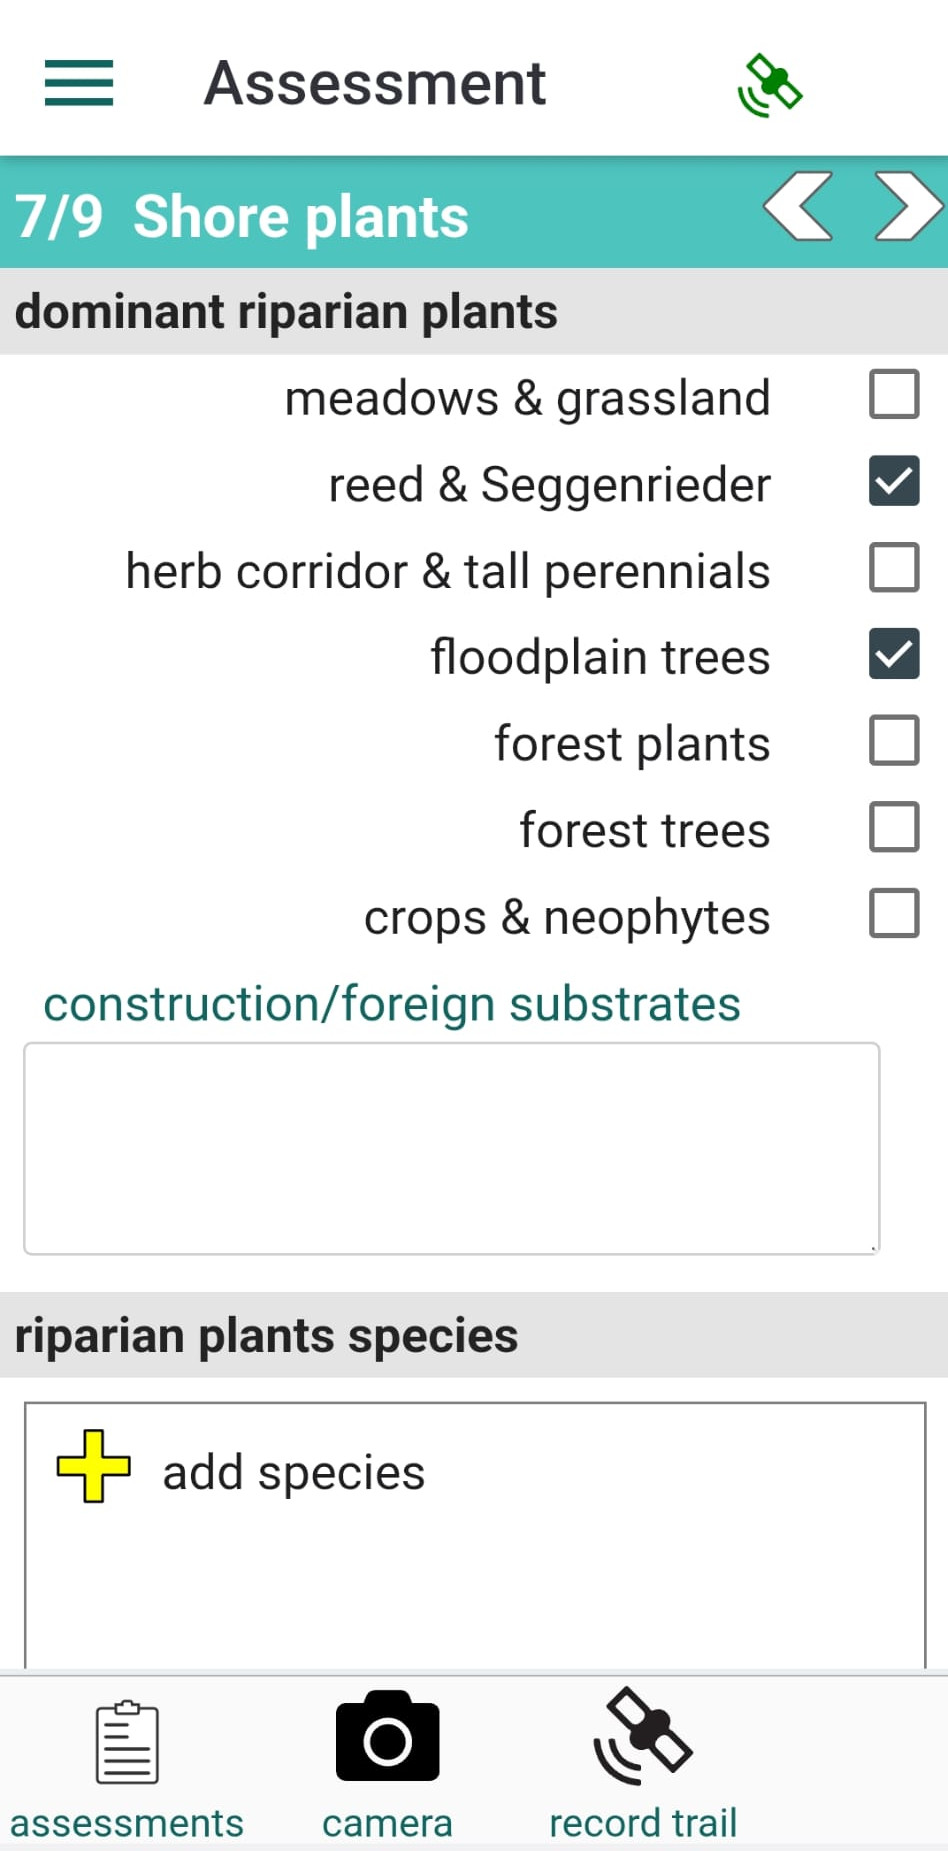
Panel 7 contains a form for recording shore plants: classify dominant riparian plants and optionally record species. Each species added to the list is also saved as an NDOR-compatible observation. Please see the section on adding species.
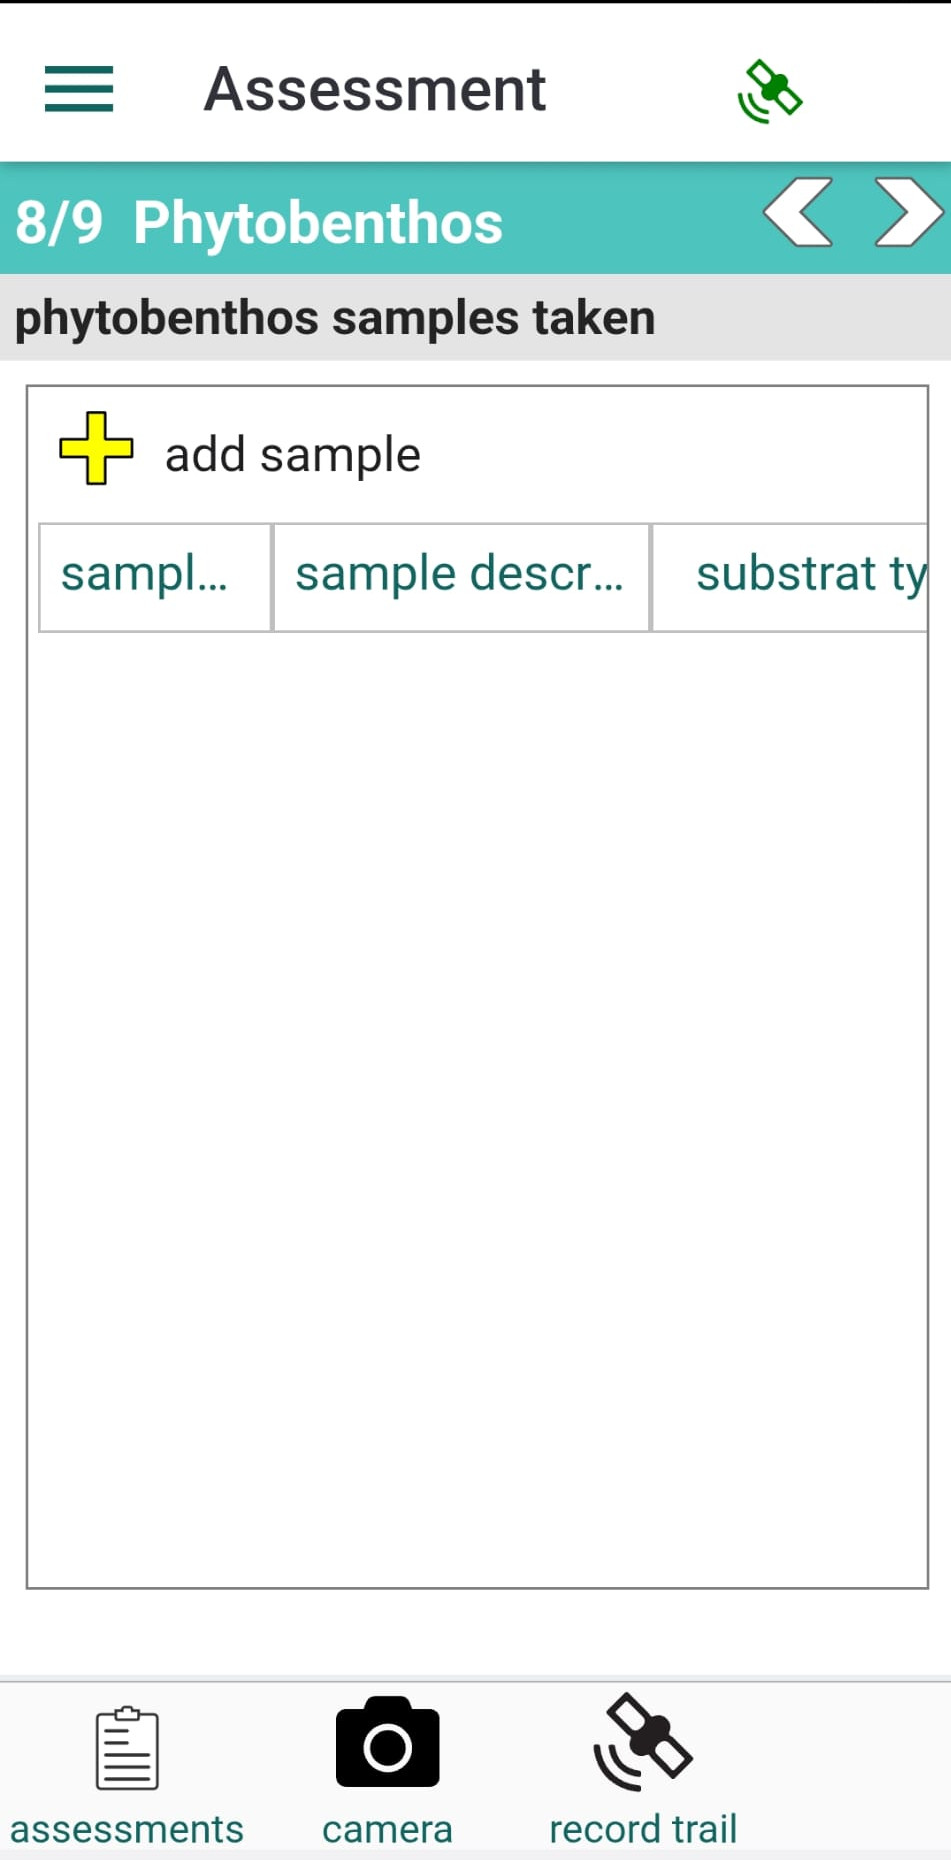
Panel 8 allows you to record phytobenthos samples.
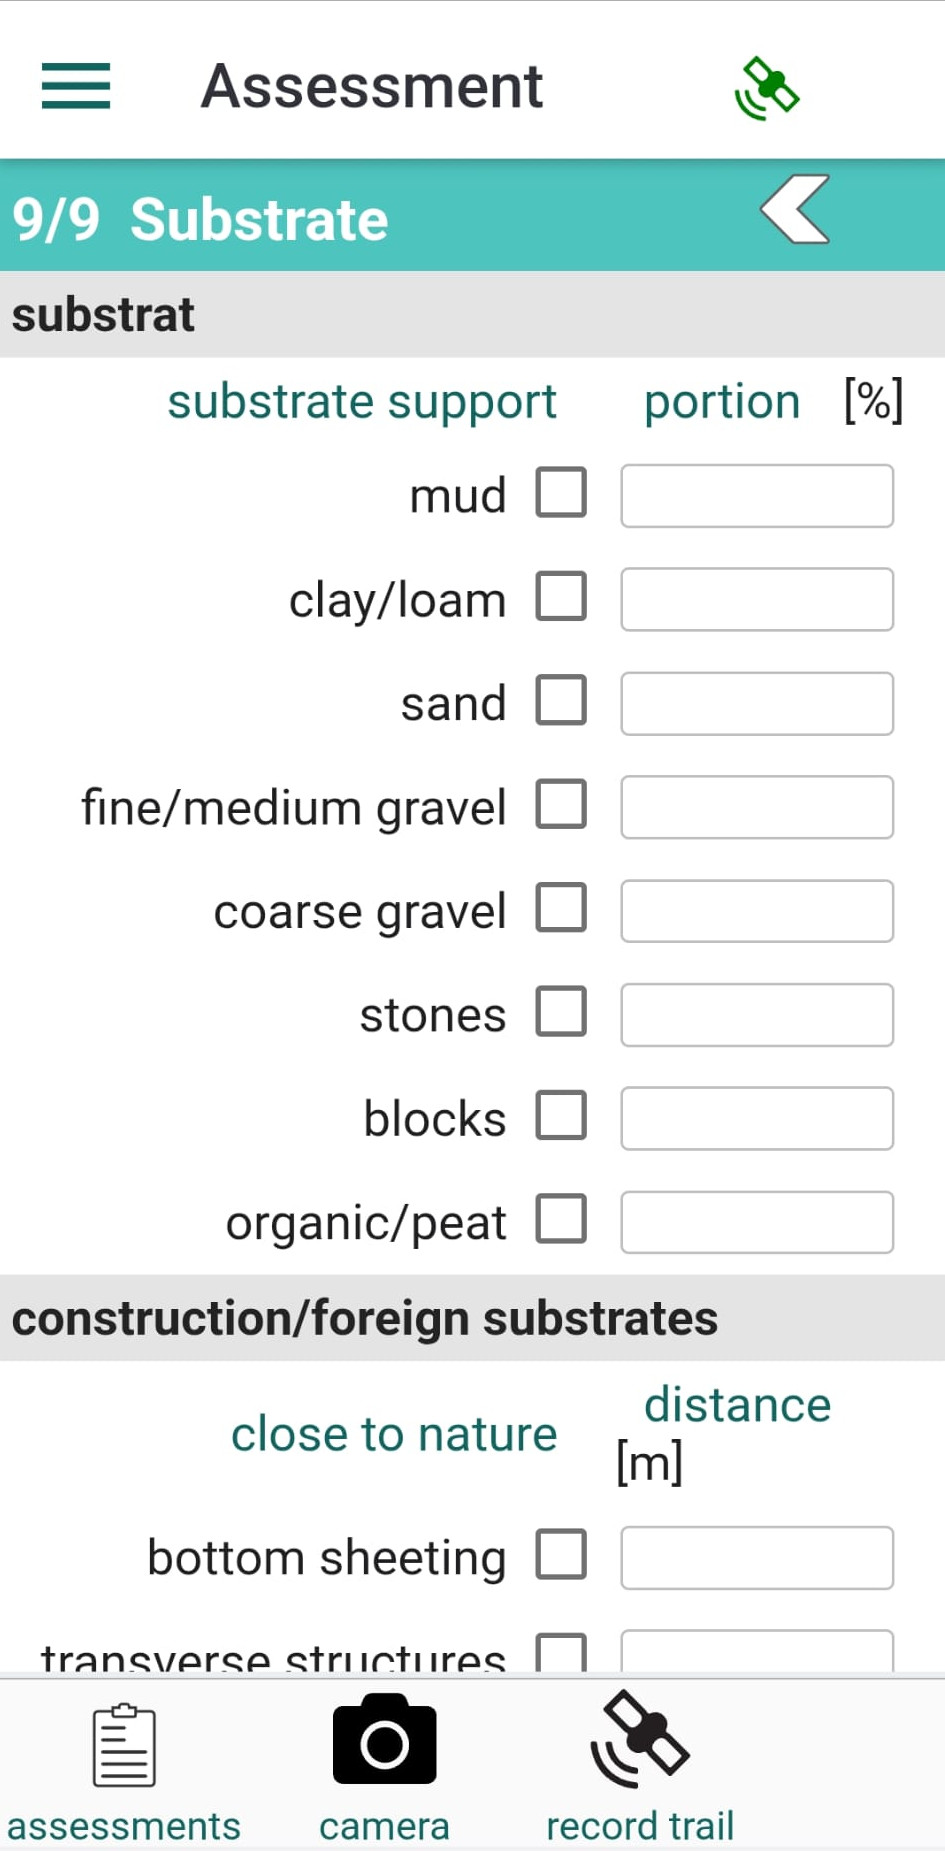
Panel 9 contains a form for describing the substrate.
Species can be recorded in several panels, wherever you see the "add species" button. The app includes a list of species commonly found in wetland areas, assembled on the kladOS platform at https://kladia.info. You can reload the species list at any time from the "Settings" panel (see the app menu).
Tapping "add species" opens a search panel for finding species.
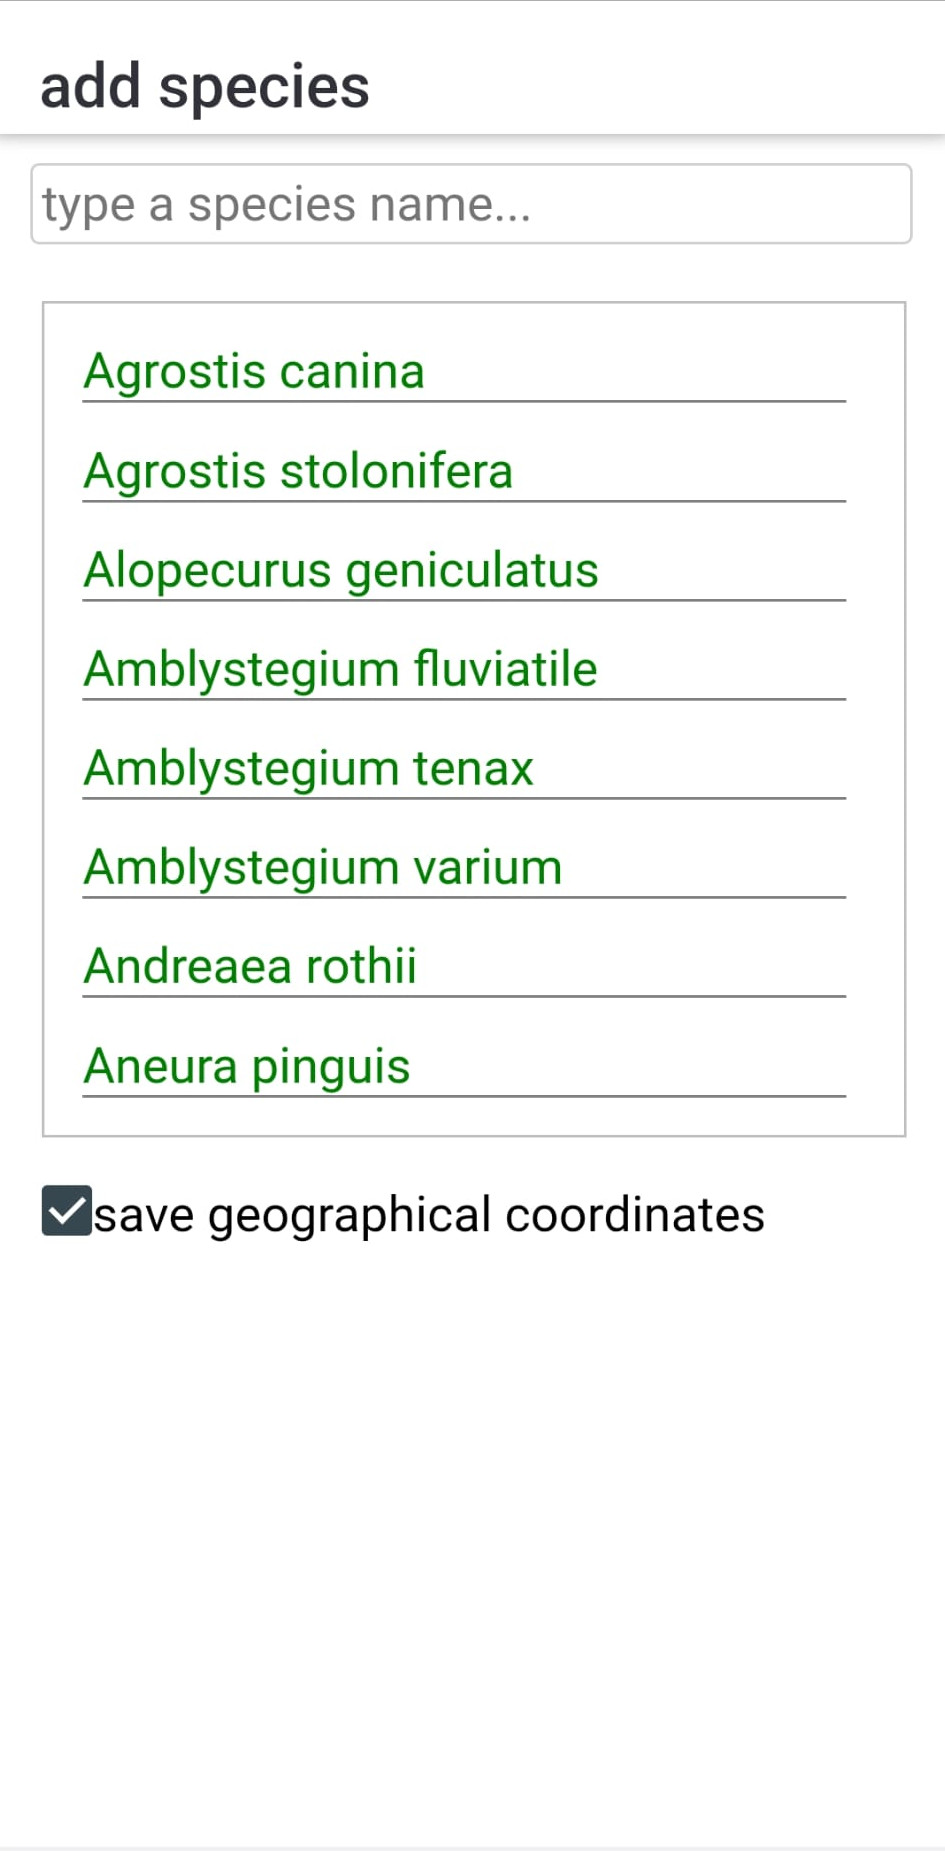
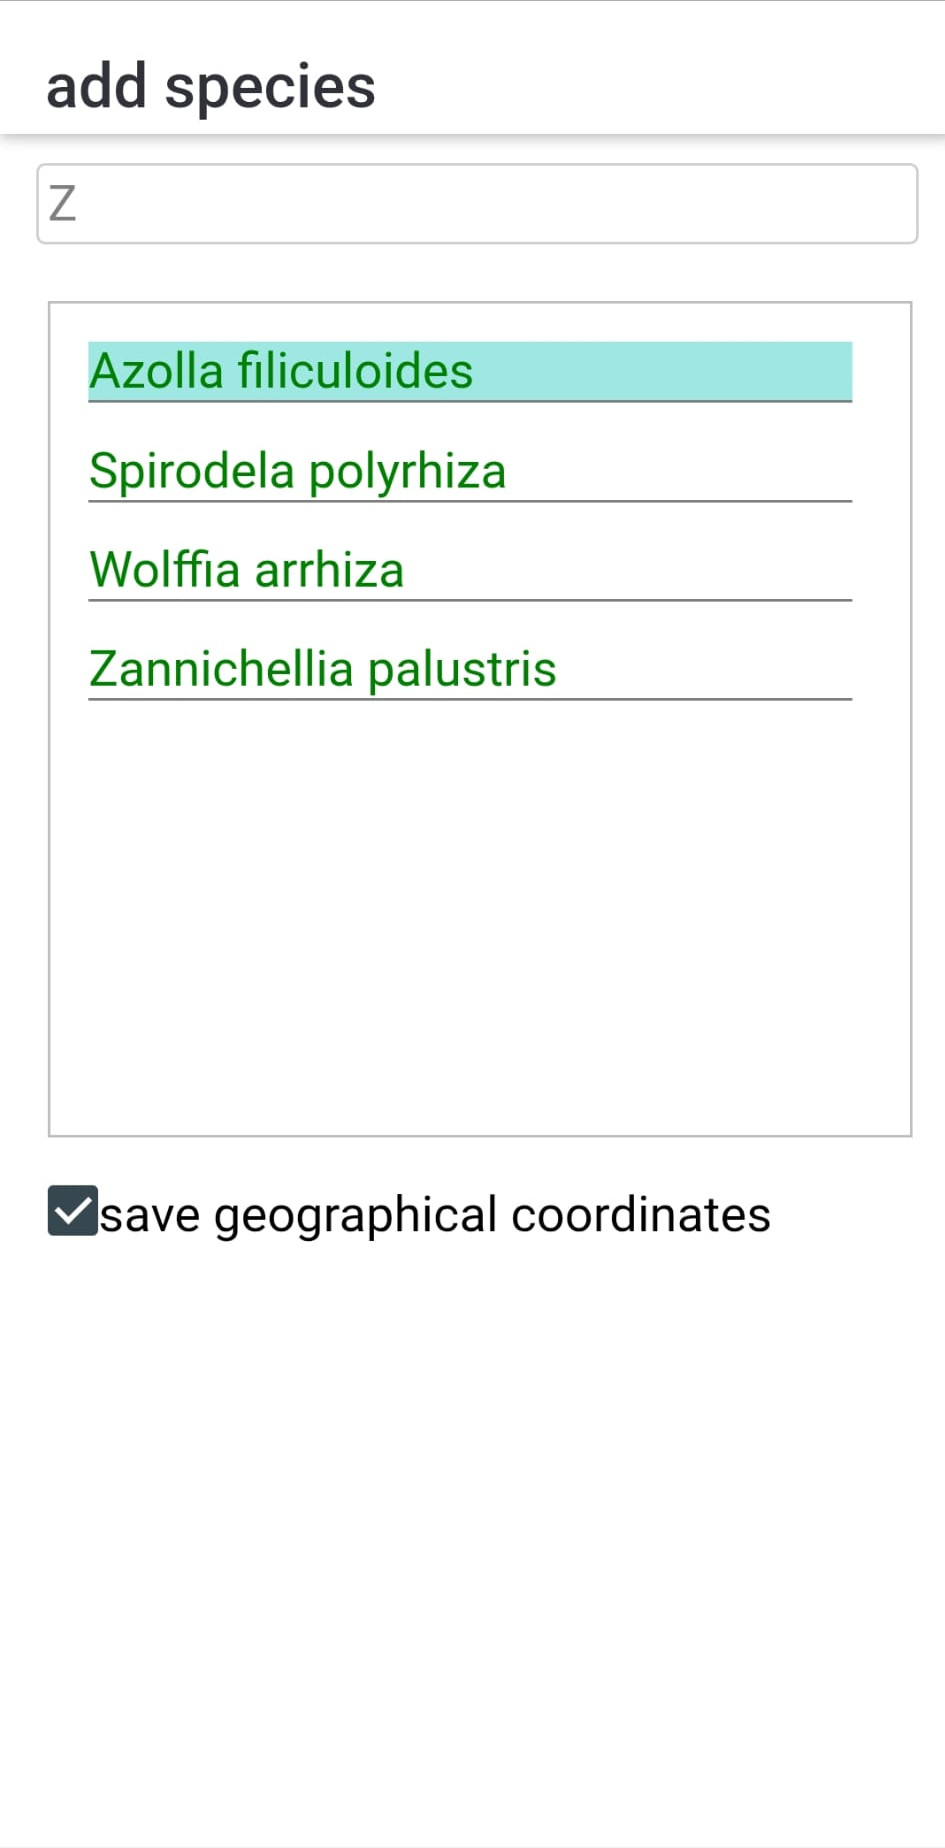
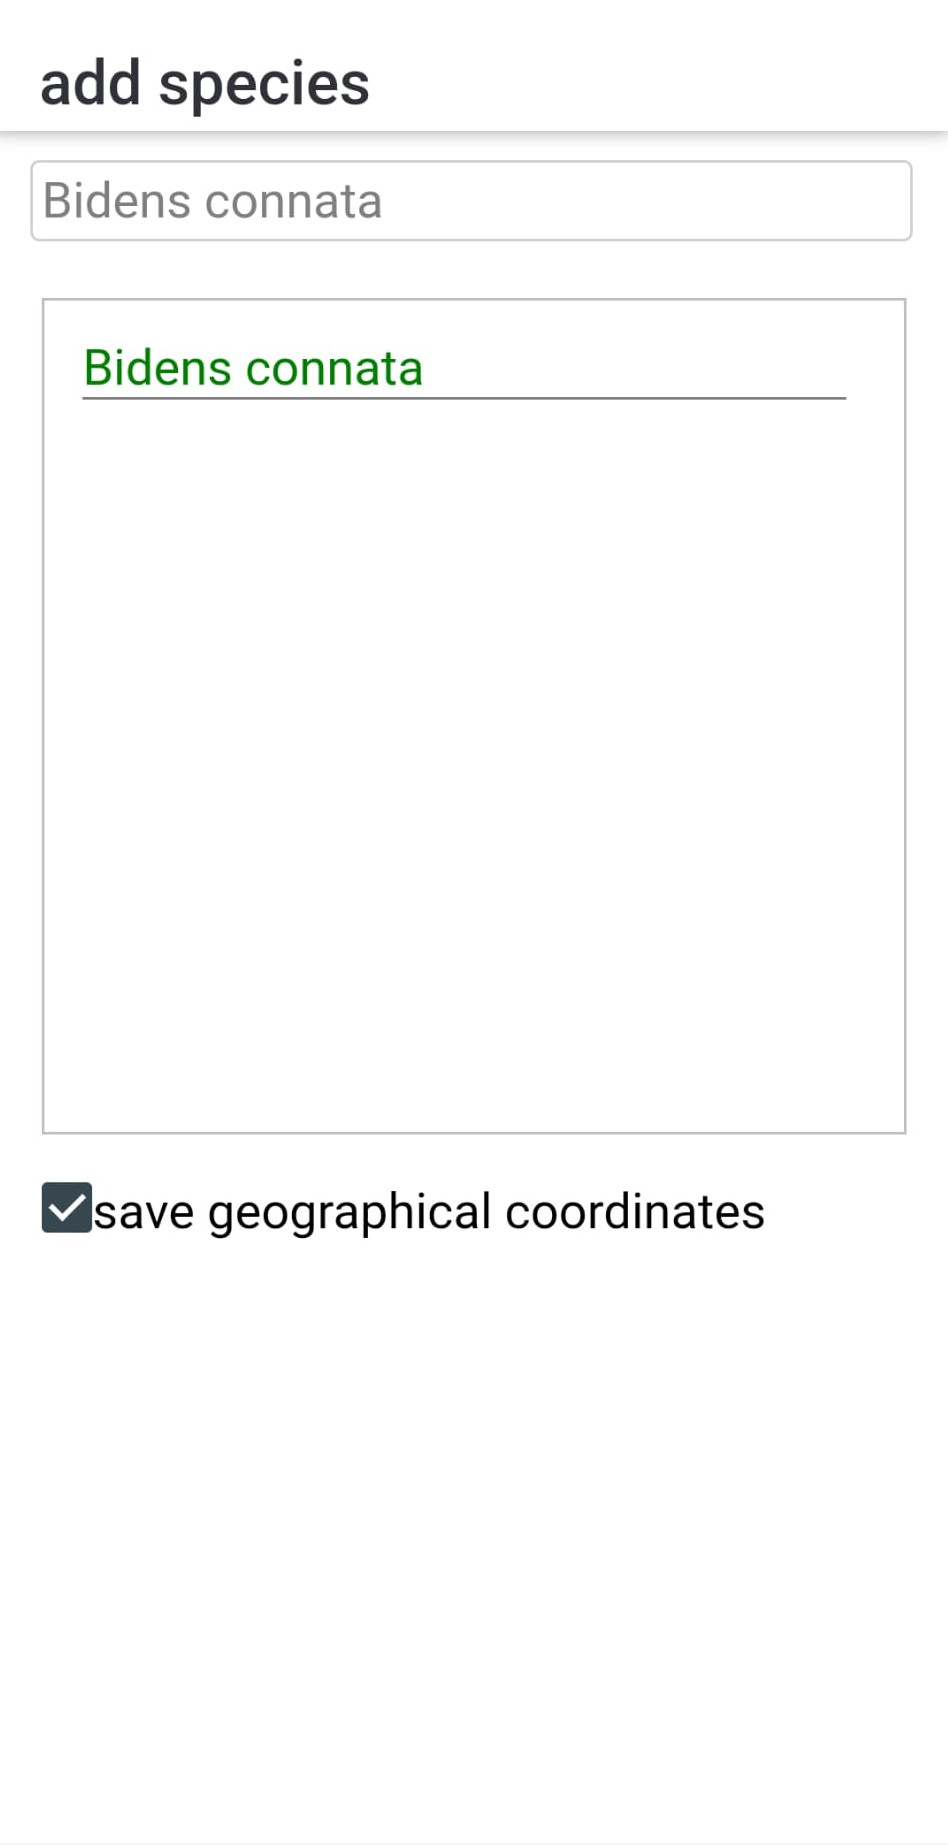
Tapping a species name automatically adds it to the current section. Added species are highlighted in cyan. If "save geographical coordinates" is checked, an NDOR-compatible observation is automatically saved in the database. This record includes the species name, latitude, longitude, and observation date. Tapping a highlighted row again removes the species from the current section.
Pressing the back button on your device returns you to the current panel.
If a species is not found in the taxa list, the searched name will appear in red.
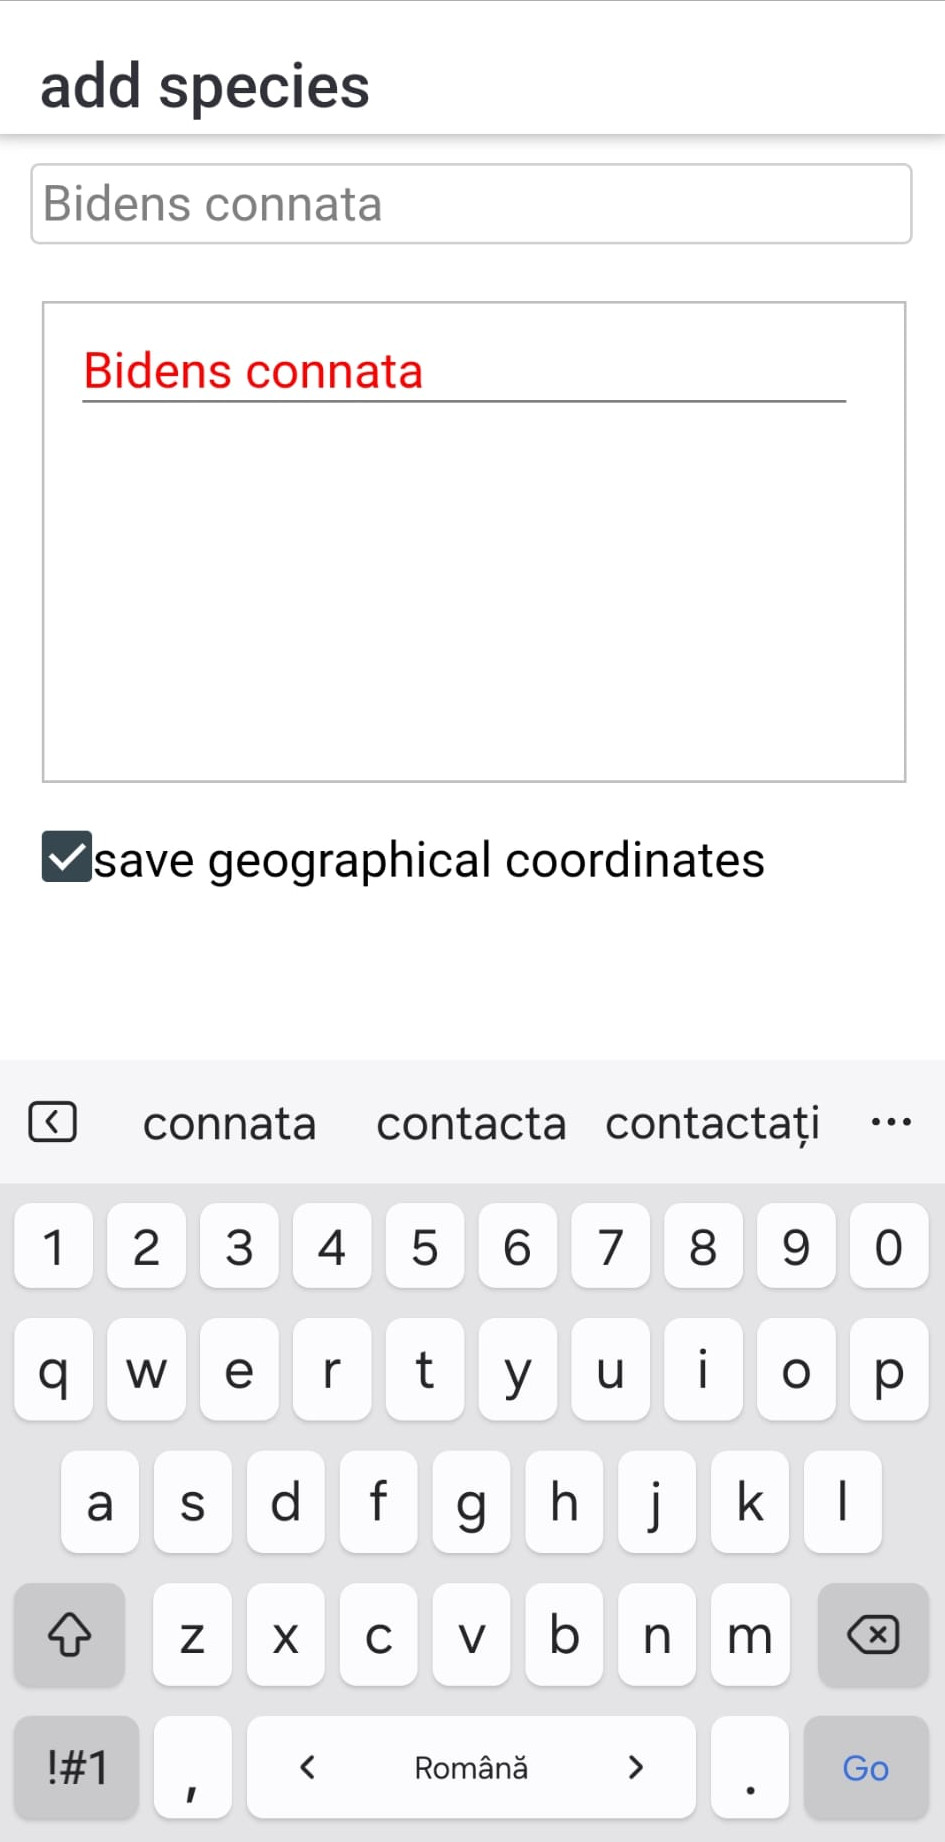
Tapping a red entry opens a confirmation dialog asking if you want to add the name to the app’s local database.
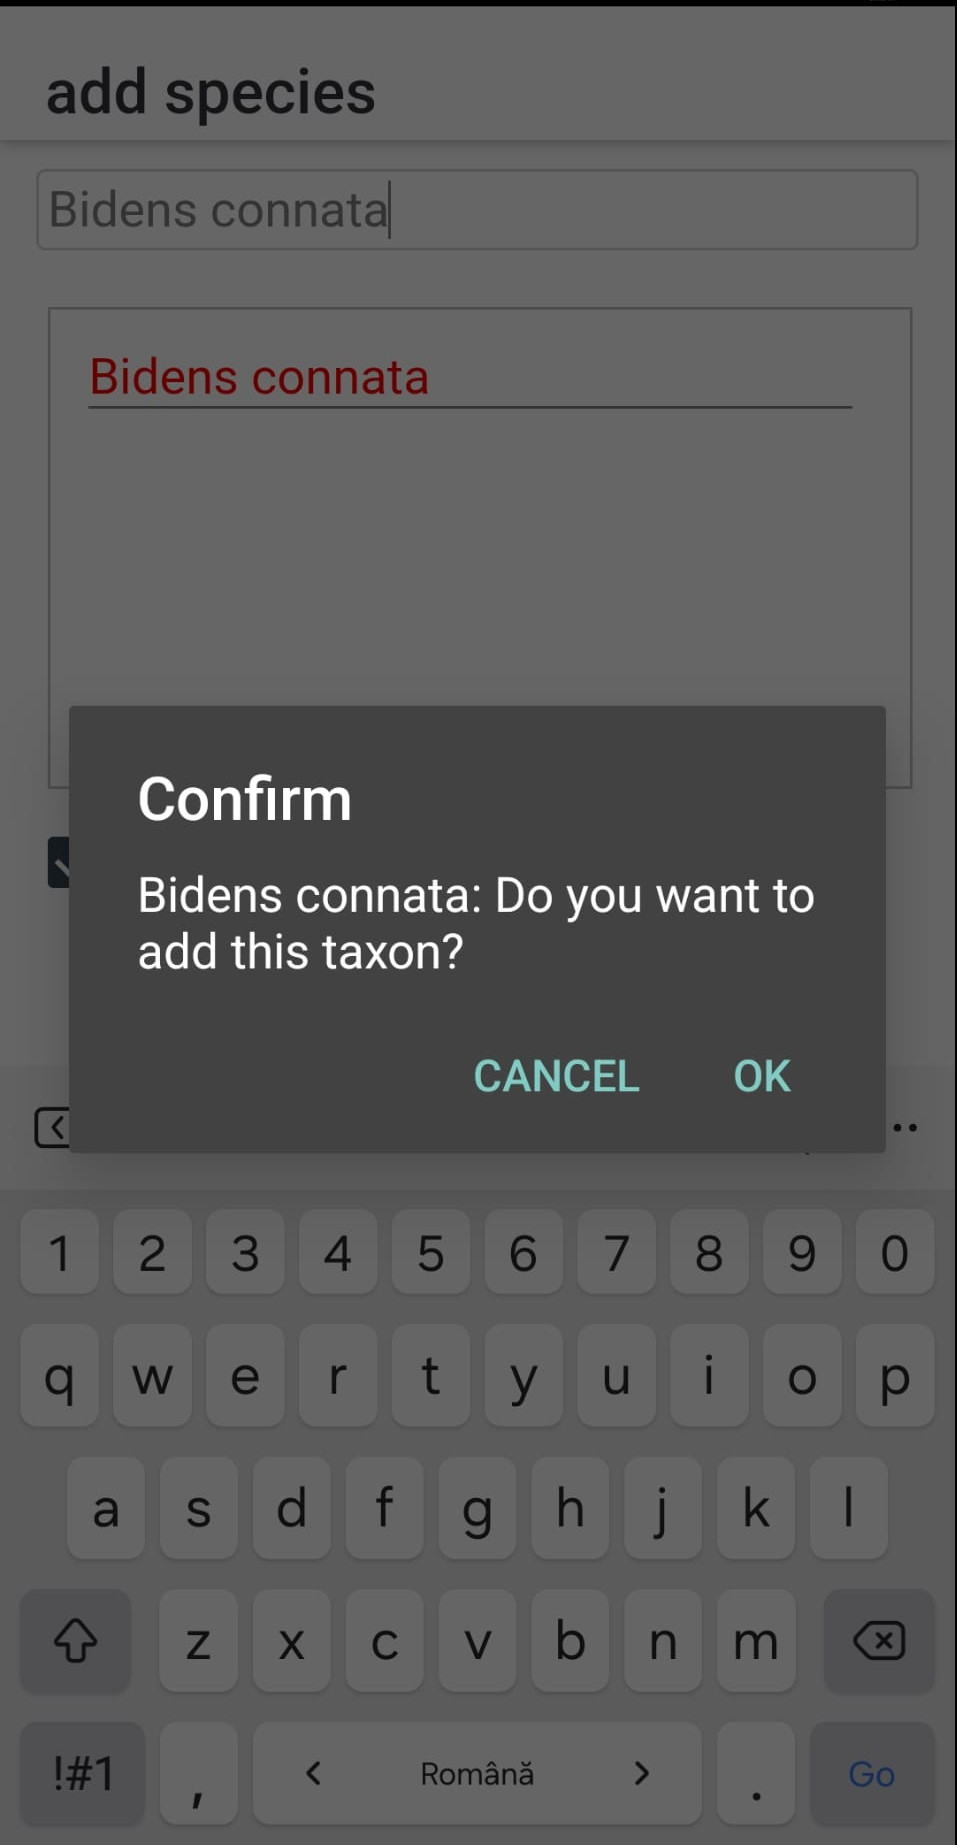
If confirmed, the taxon is saved to the database and will no longer appear in red.
The toolbar button labeled "delete taxon" removes the species name from the current section.
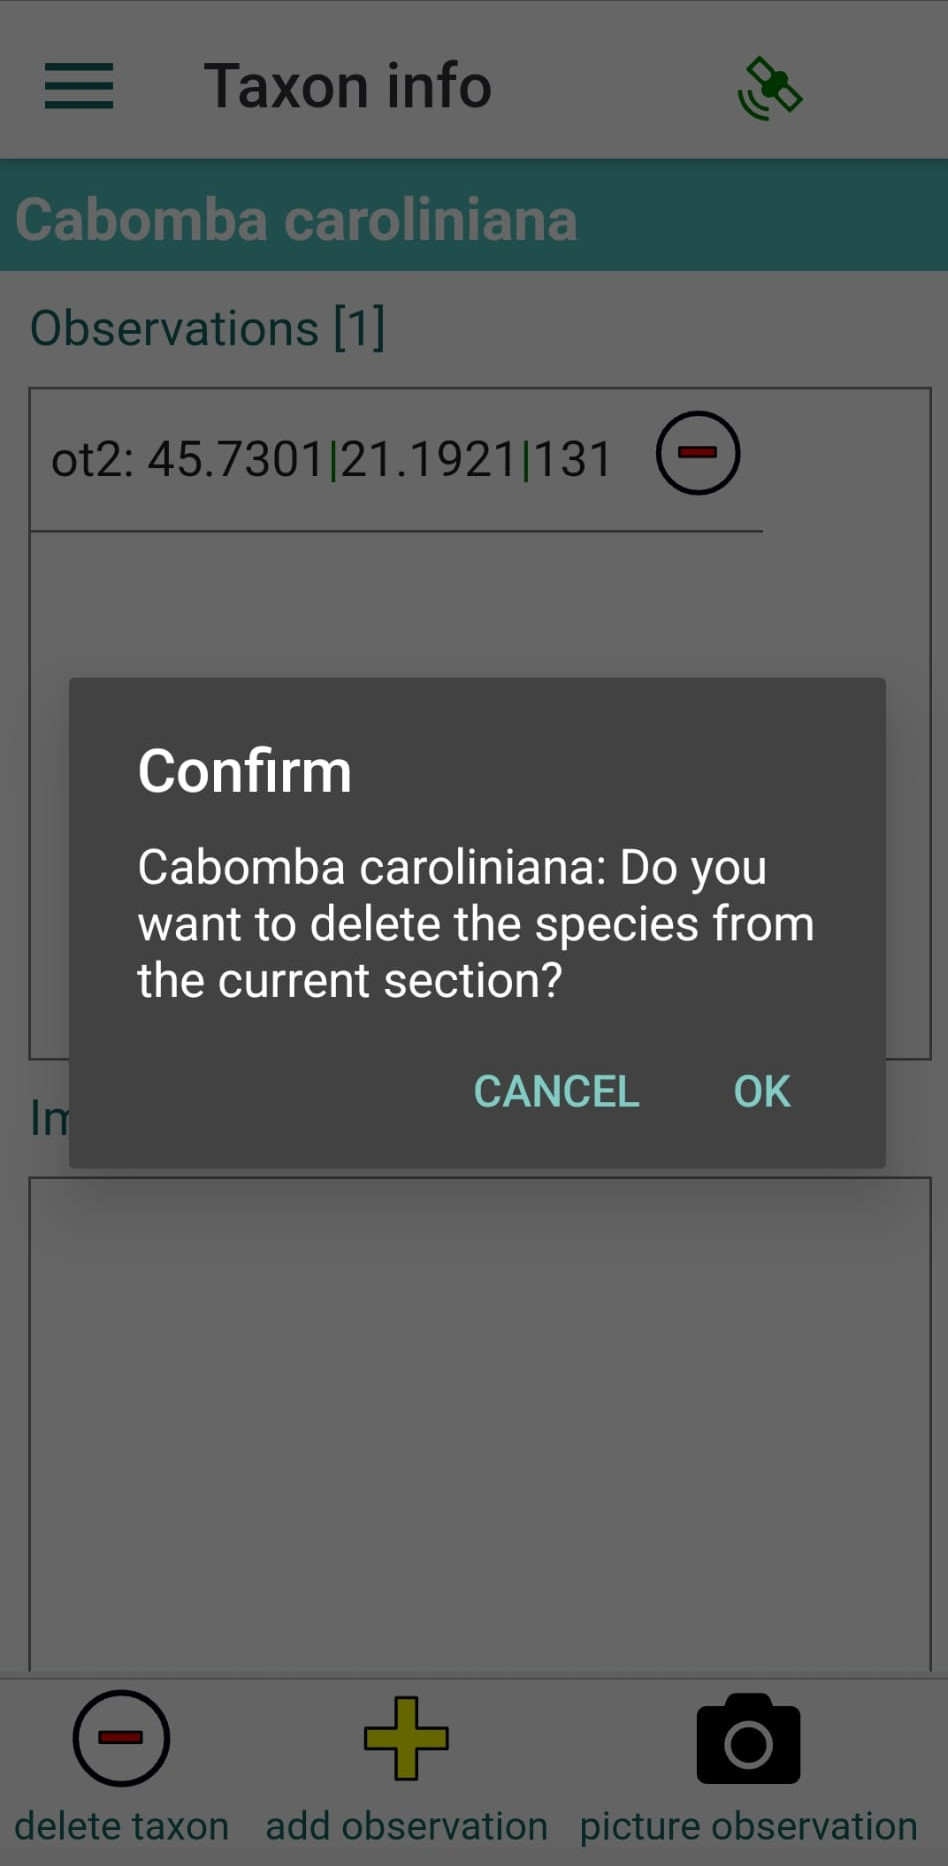
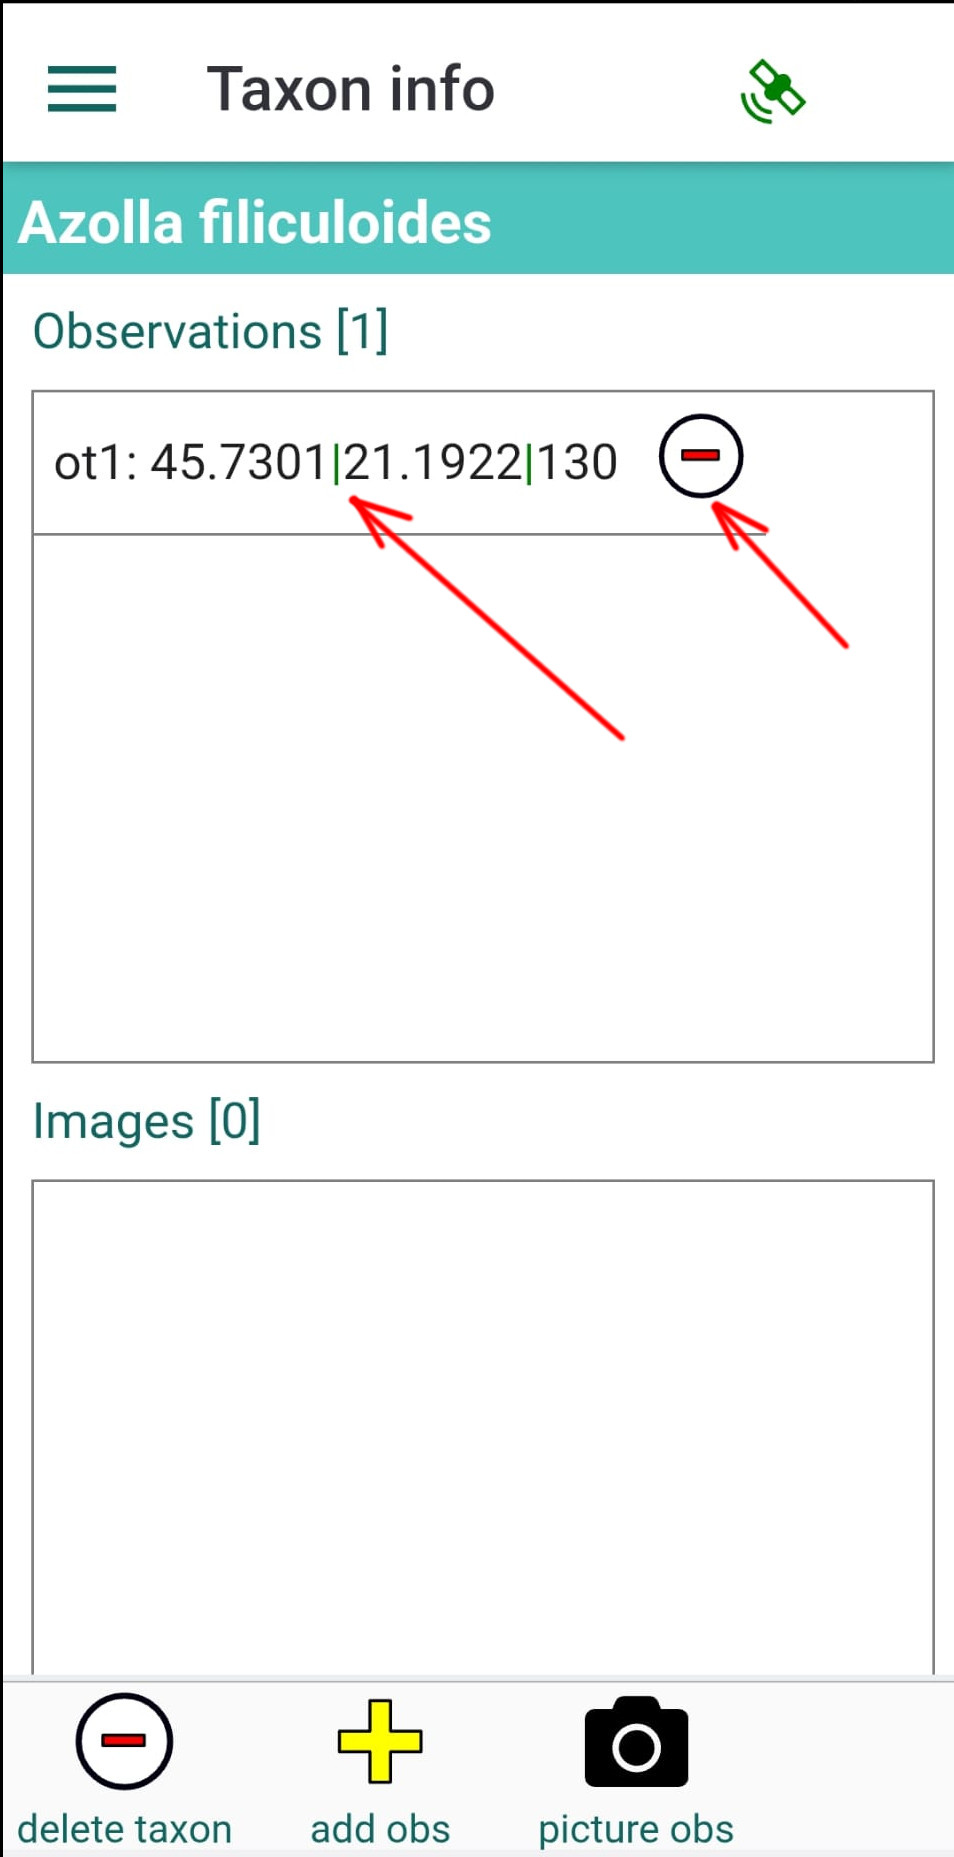
If "save geographical coordinates" is checked in the "add species" panel, an NDOR-compatible organism observation is automatically added to the local database. These observations will be uploaded to the https://kladia.info server and can later be integrated into the NDOR database. By tapping on a species name added to one of the panels, a list of observations for that species will be displayed. You can delete an observation by tapping the red minus button on the right side of the observation row. Additional observations of the same species can be recorded using the toolbar buttons. The "Delete taxon" button removes all observations and deletes the species from the current panel.
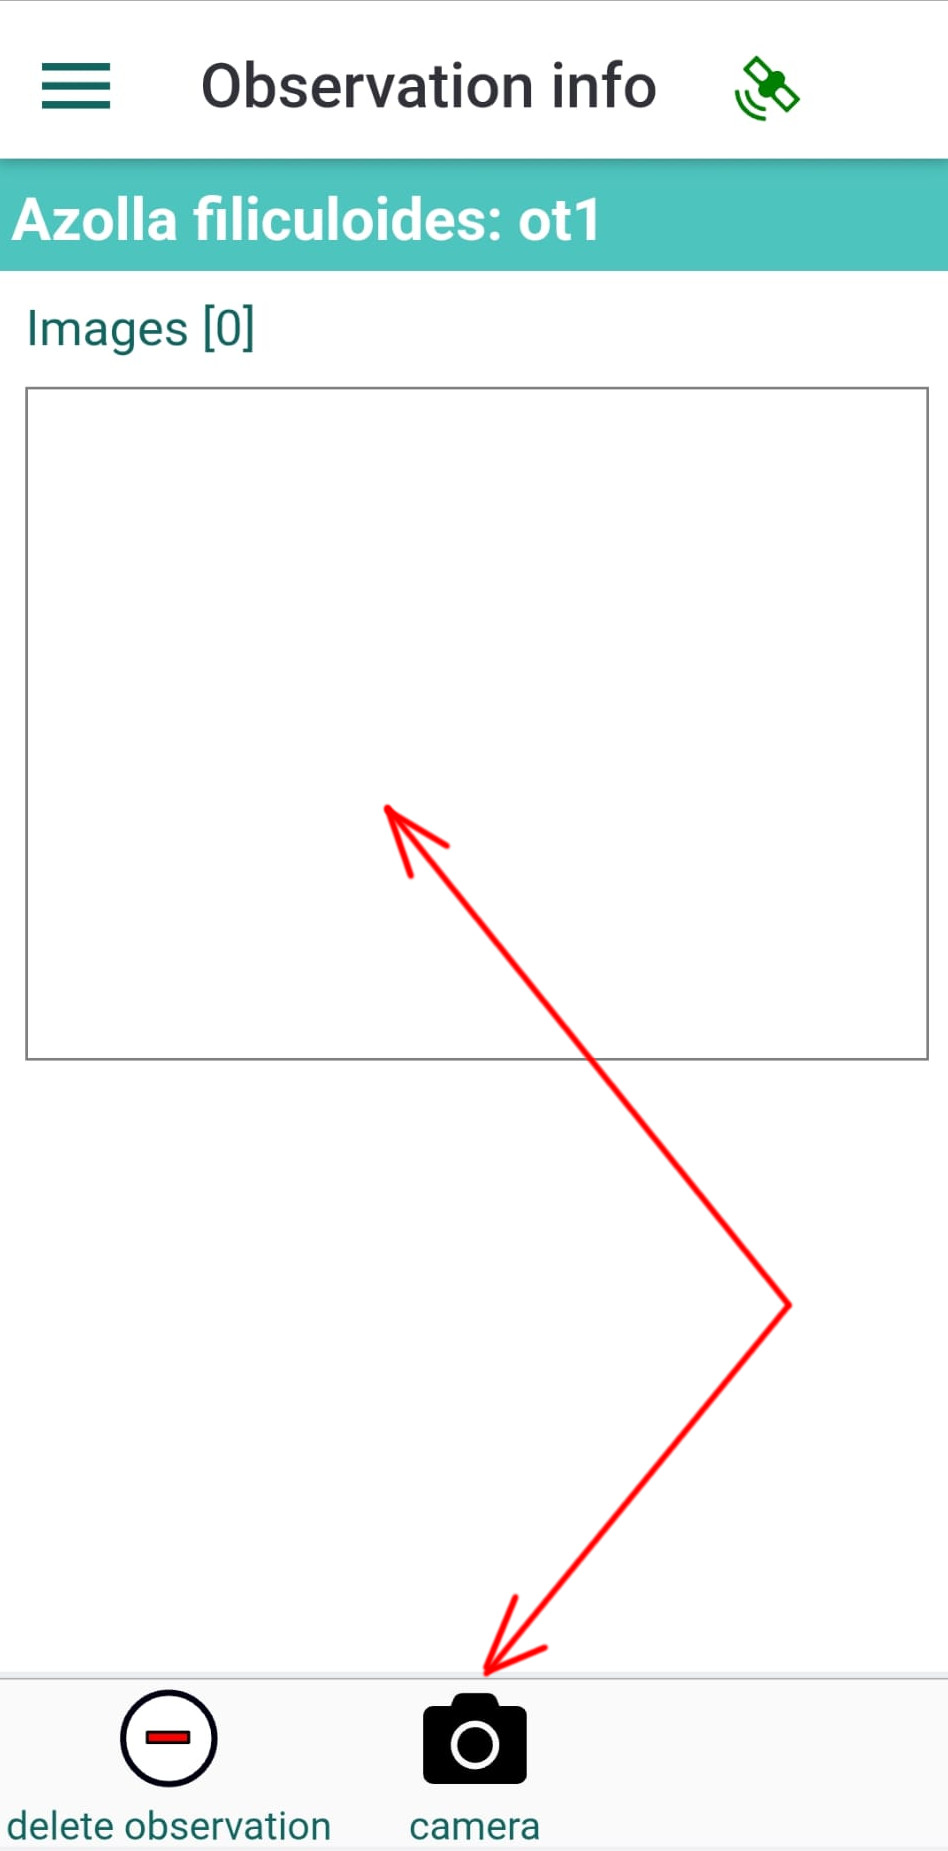
You can take pictures for an observation by tapping the observation row and then opening the camera from the toolbar of the observation panel. Multiple pictures can be recorded for each observation.
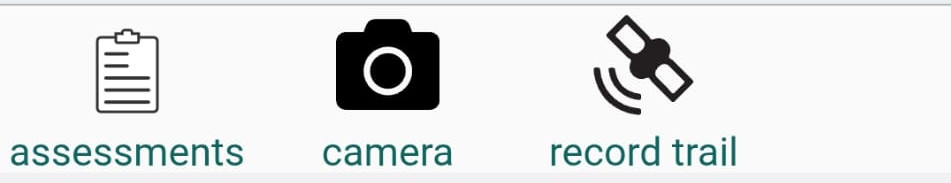
The Assessments button opens the list of existing assessments, allowing you to view, create, or edit survey entries.
The Camera button allows you to take pictures. Pictures are specifically associated with the currently open panel, so please take photos of subjects relevant to the active section. MacrophyteMapper lets you take one or more pictures for plant observations and document each species in lists or tables. If your device's GPS is enabled, each image is tagged with geographic coordinates, so the observations can be displayed on maps.
The Record Trail button starts recording your GPS track as you move. This feature is useful for visualizing the survey route on the map.