sensorManager and participatory air quality monitoring
myNature Association combines portable ATMOTUBE sensors with its own data exploration application, transforming measurements collected by people into maps that show where, when and how the air around us changes.
Air quality is neither uniform nor static. It can change from one street to another and from one hour to the next, while a single fixed monitoring station captures only part of this reality. Understanding the bigger picture requires numerous observations collected in different places and at different times, as well as a tool that places them in a clear and accessible context.
This led to the development of sensorManager, an application created within the mybiOSis ecosystem to explore data collected with mobile ATMOTUBE units. The tool brings together field measurements, organizes them into monitoring campaigns and transforms them into an interactive map of air quality across space and time.
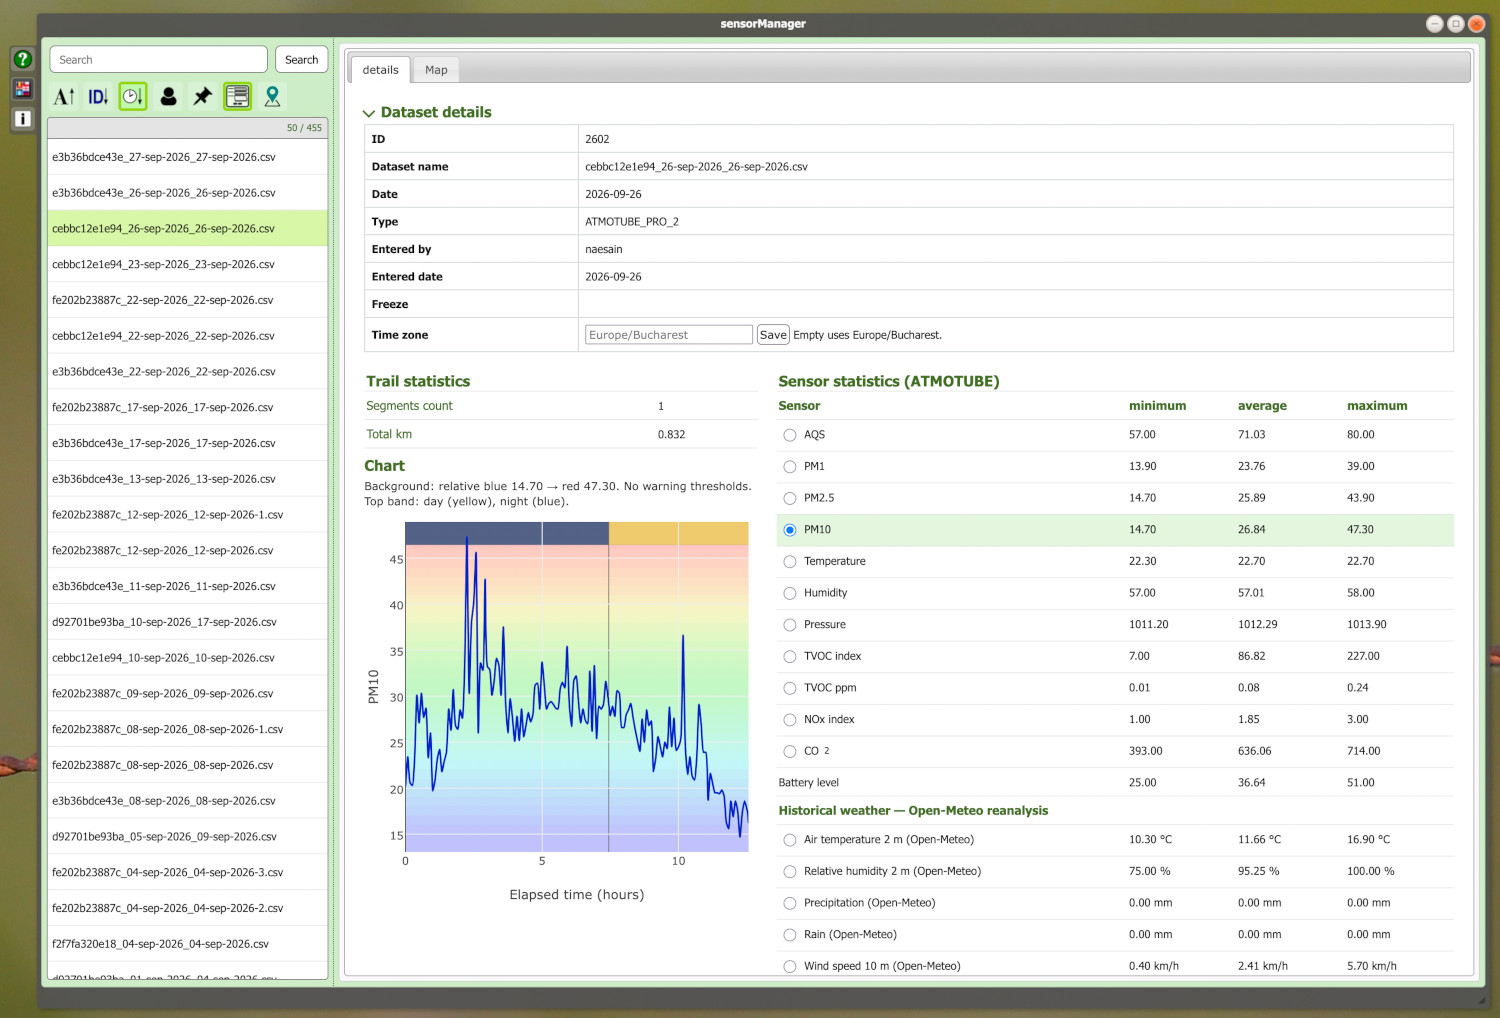
A monitoring campaign in sensorManager, with statistics, a time-series chart, and dataset metadata.
From individual observations to a shared picture
In a citizen science campaign, each sensor becomes a mobile witness. Participants can record conditions along streets, routes, neighbourhoods or natural areas. Viewed separately, these records are points on a map. When brought together, they can reveal patterns that would remain invisible in isolated measurements.
sensorManager preserves the connection between the bigger picture and the observation that generated it. Users can search and organize datasets, examine a single campaign or display multiple campaigns on the same map. The original data remain available for verification, together with the measurement time, coordinates, sensor identifier, positioning accuracy, altitude, battery status and other contextual information.
What the application measures and explains
For each campaign, the application calculates minimum, average and maximum values and presents the distance covered, route segments and dataset metadata. Depending on the sensor, users can monitor:
- the Air Quality Score (AQS);
- PM1, PM2.5 and PM10 particulate matter;
- carbon dioxide (CO₂);
- total volatile organic compounds (TVOC) and the TVOC and NOx indices;
- temperature, relative humidity and atmospheric pressure;
- battery level and information about device operation.
These summaries help users understand the overall profile of a monitoring activity, identify unusual values and compare environmental conditions across different places or time intervals.
A map that shows where and when
At the centre of the application is an interactive map that groups measurements into 500-metre hexagonal cells. Each cell represents a measured area and is coloured according to the selected parameter. Dynamic legends explain the active scale, while users can quickly switch between AQS, particulate matter, CO₂, TVOC, temperature, humidity and pressure.
Clicking a cell opens its local profile, showing the number of measurements, the value of the active parameter, the contributing units and changes over time. The map therefore provides more than a coloured visualization: it preserves a clear connection to the data from which it was created.
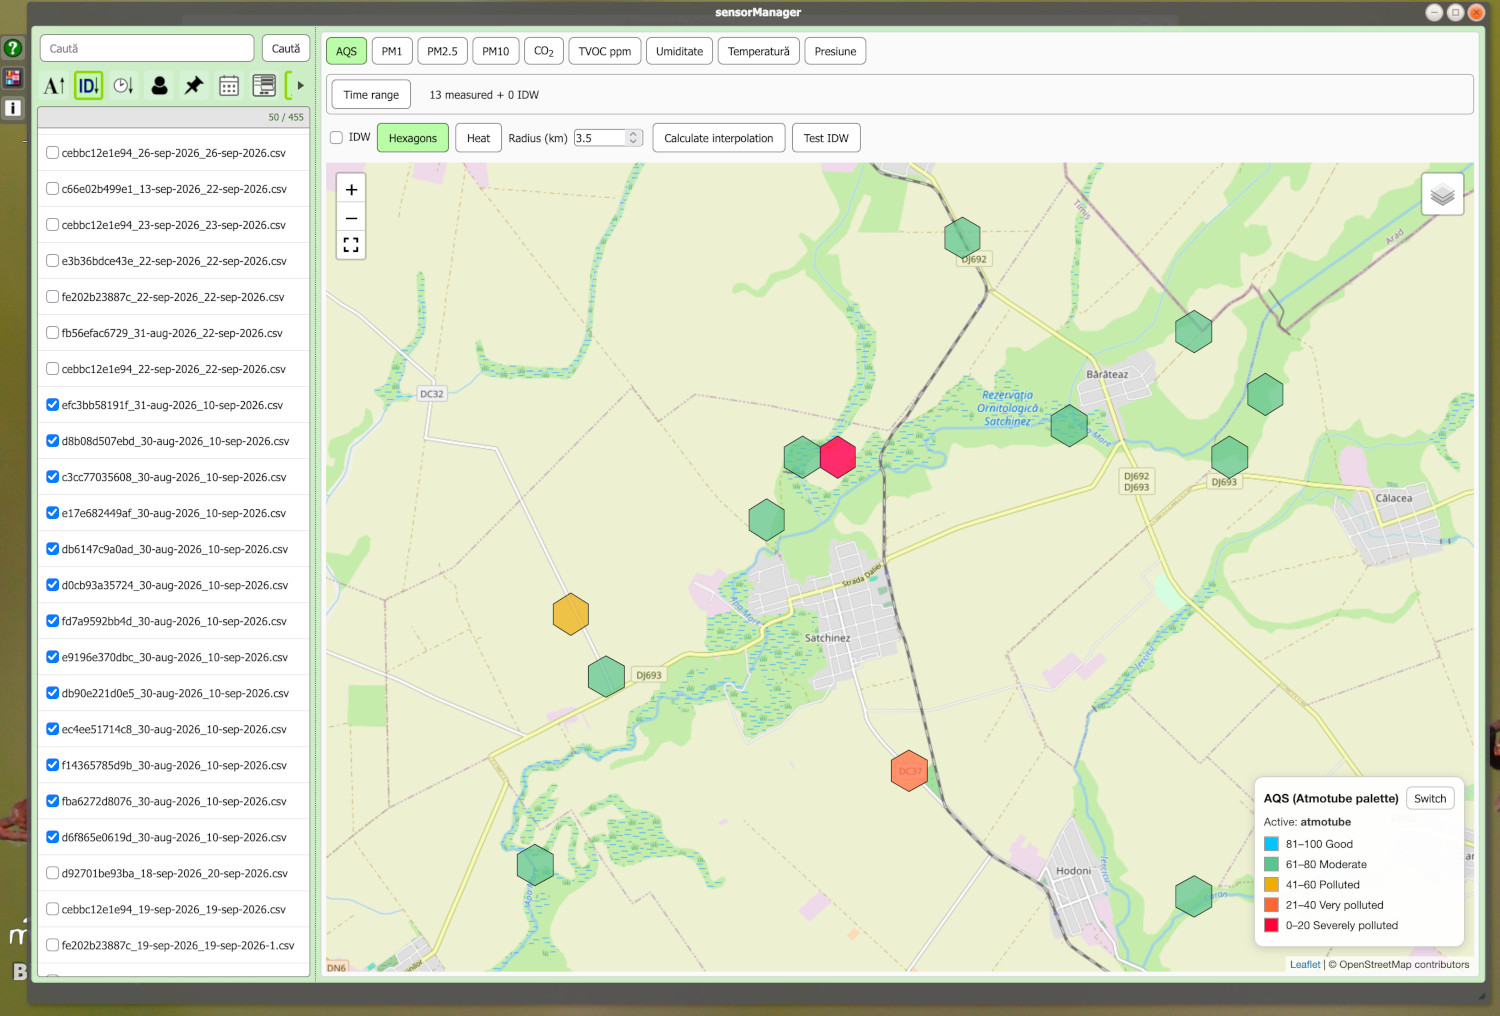
Mobile stations deployed for a monitoring campaign in the Satchinez area.
Tracking change over time
Environmental conditions are constantly changing. In sensorManager, users can select a time interval, define the duration of the observation window and move it along a detailed timeline. The map is recalculated for each period, while the playback controls make it possible to follow the changes step by step. A coverage scanner identifies the intervals during which at least five distinct units were active and helps users find the moments with the highest data density.
When a regional event calls for field measurements
In the summer of 2026, the fires in the Deliblatska Peščara region of Serbian Vojvodina, together with active fire outbreaks in Caraș-Severin County, increased environmental pressure across western Romania. In response, myNature Association deployed portable ATMOTUBE sensors at several locations, providing significant coverage south of Timișoara.
The aim was to document the spatial and temporal evolution of particulate matter associated with the event. The measurements collected in the field were then processed in sensorManager to produce successive snapshots of particulate matter distribution. This made it possible to observe the extent and movement of the pollution plume beyond the individual locations where the sensors had been deployed.
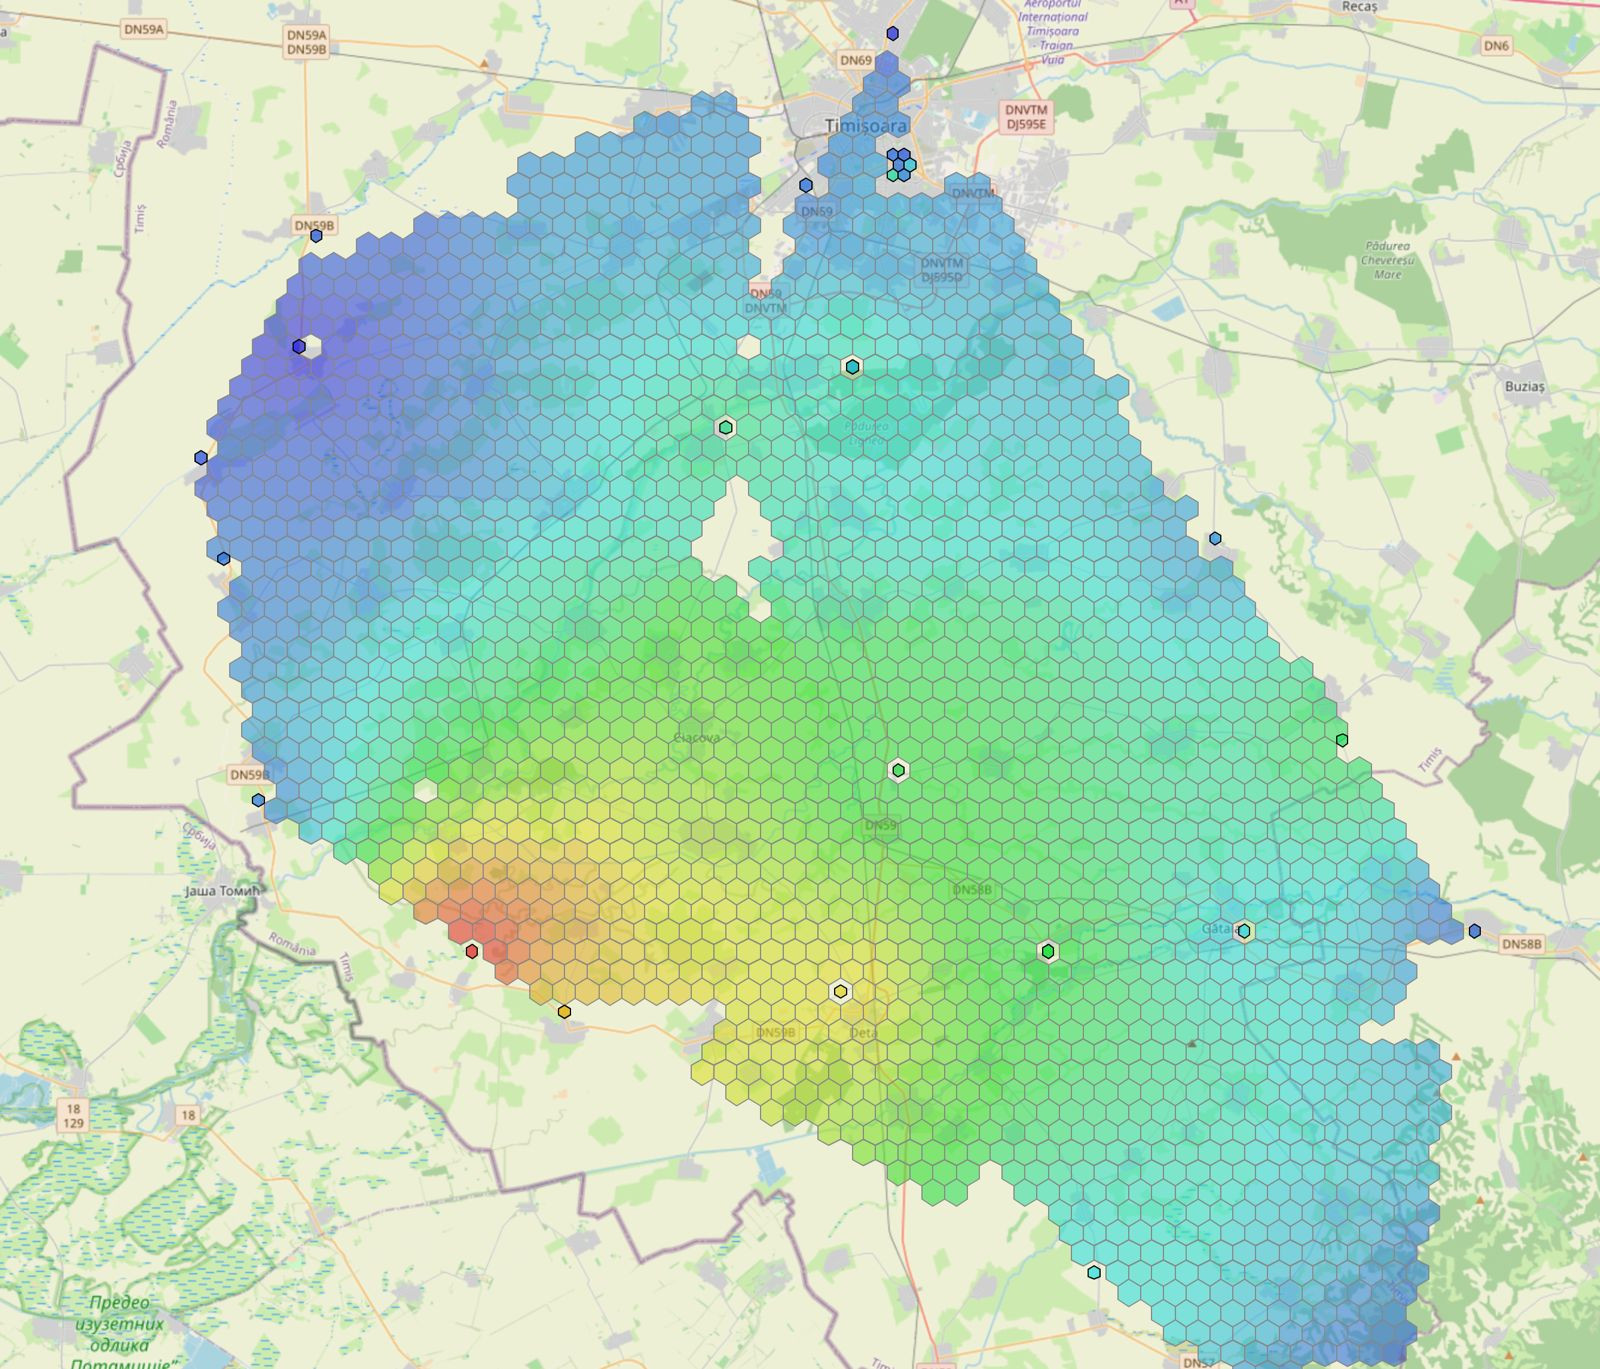
Map obtained by interpolating data collected after the fire in the Deliblatska Peščara region.
The approach was subsequently tested in the Satchinez area, covering a smaller area but using a higher density of monitoring units. The measurements revealed complex dynamics influenced by local activities and weather conditions, with significant variations throughout the same day.
Interpolation supports exploration without replacing measurement
When spatial coverage is sufficient, sensorManager can estimate values between measured points using IDW interpolation, a method based on the distance from the available observations. The result can be displayed as a hexagonal layer or a heatmap surface to explore the possible continuity of a phenomenon.
The application maintains a clear visual distinction between measured and estimated cells. Interpolation does not overwrite actual observations and is limited to the area covered by the measurements. Coverage and error indicators support critical interpretation: the resulting surfaces are exploratory models, not independent evidence, and do not replace direct measurement.
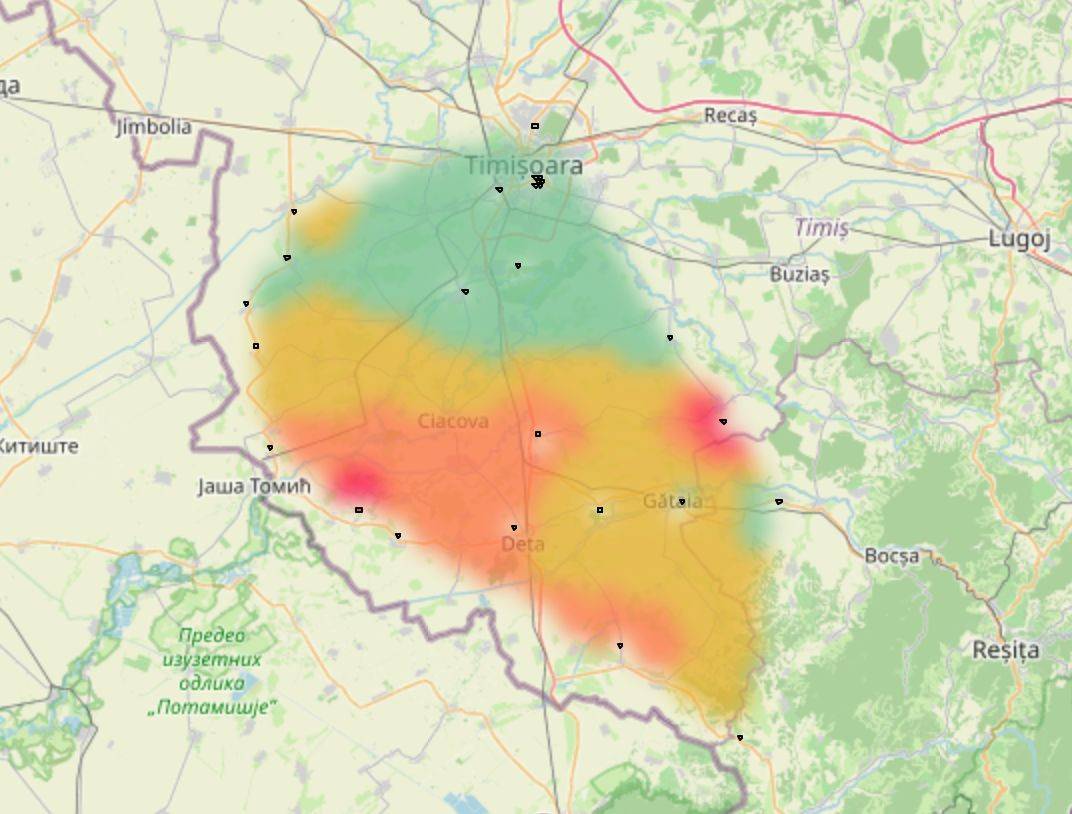
A temporal sequence can demonstrate how the particle distribution changes and how a pollution cloud disperses and moves.
Weather data provide additional context
For datasets collected by fixed monitoring stations, sensor measurements can be compared with historical meteorological information from Open-Meteo reanalysis data, including temperature and humidity, precipitation, wind speed and gusts, atmospheric pressure, cloud cover, and the temperature and moisture of the upper soil layer. This information is explicitly identified as reanalysis data and is not presented as if it had been measured by the ATMOTUBE units.
Why it matters for communities
The value of this approach lies not only in the technology, but also in the way people can contribute to understanding their environment. Observations from multiple people, devices, routes and moments can come together to form a shared picture without losing their connection to the original data.
Activities that are implemented systematically and documented rigorously can support the development of dense monitoring networks based on numerous affordable sensors. These networks should not be viewed as an automatic substitute for reference monitoring stations, but as a complementary resource capable of providing finer spatial coverage, identifying areas that warrant further investigation and supporting the timely communication of information to local communities.
An invitation to collaborate
Through sensorManager, an individual observation can become part of a living map of the air around us. myNature Association aims to continue developing the tool and its participatory monitoring activities in collaboration with citizens, researchers, schools, organizations and local authorities interested in environmental data that more closely reflect conditions in the field.
The result is a form of knowledge built collectively: we can see what was measured, where the measurement took place, how conditions changed and how individual contributions can become useful information for the entire community.
Subject to the availability of monitoring units, myNature Association invites residents from as many communities as possible across Timiș County to join the participatory monitoring network. We are looking for participants willing to take responsibility for an ATMOTUBE sensor and use it in the field, helping us achieve the widest possible geographic distribution of the available units across the county.
Participation will be arranged according to sensor availability and the areas where improved coverage is most needed. The collected measurements can then be brought together and explored in sensorManager. The more widely the sensors are distributed across Timiș County, the more detailed our understanding can become of how environmental conditions vary between communities and change over time.
While official regulatory monitoring stations provide essential long-term data, distributed citizen-science sensors can help fill important gaps by capturing local fluctuations as pollution moves across administrative and national borders.
Ultimately, this episode underscores the importance of cross-border cooperation and shared environmental data. The Deliblatska Peščara fire remains an ecological disaster and an emergency for Serbia, but the widespread dispersal of its smoke demonstrates that regional environmental challenges require joint solutions. Project partners will continue to track data from sensors in the RORS00127 network over the coming days to monitor changes in air quality across the border region.
Project website: https://kladia.info/RORS/
Air Quality Monitoring System sensor results: https://kladia.info/RORS/sensors.php
This material was prepared within the project “CBC Network for Sustainable Use of Natural Resources” (RORS00127), implemented with financial support from the European Union through the Interreg IPA Romania–Serbia Programme 2021–2027.
The responsibility for the content of this material lies with the author(s). The content of this material does not necessarily represent the official position of the European Union.
The measurements presented in this article are indicative measurements obtained using portable sensors within a citizen-science monitoring network. They complement, but do not replace, official air-quality monitoring carried out using regulatory reference methods.