What Can a Sensor Network Tell Us About Fires in a Protected Wetland in Romania? The Satchinez Case
On the evening of September 24, 2026, a wildfire broke out in dry vegetation and reedbeds between Satchinez and Gelu. The fire affected approximately 80 hectares, and smoke carried by the wind reached the Timișoara area. The event was reported by the local media.
Following the fire, MYNATURE Association deployed a network of 20 environmental sensors across the area. Each device was installed at a different location and measured airborne particulate matter, volatile organic compounds, carbon dioxide, and local atmospheric conditions.
A single sensor can tell us what is happening at one location. A network can begin to reveal what is happening across an entire landscape.
Our aim was not to assume from the outset that every measured value was caused by the fire. Instead, we wanted to explore what kind of picture a distributed sensor network could build in the aftermath of such an event: where changes occur, how long they persist, how many monitoring locations detect them, and how they relate to wind conditions and the burned area.
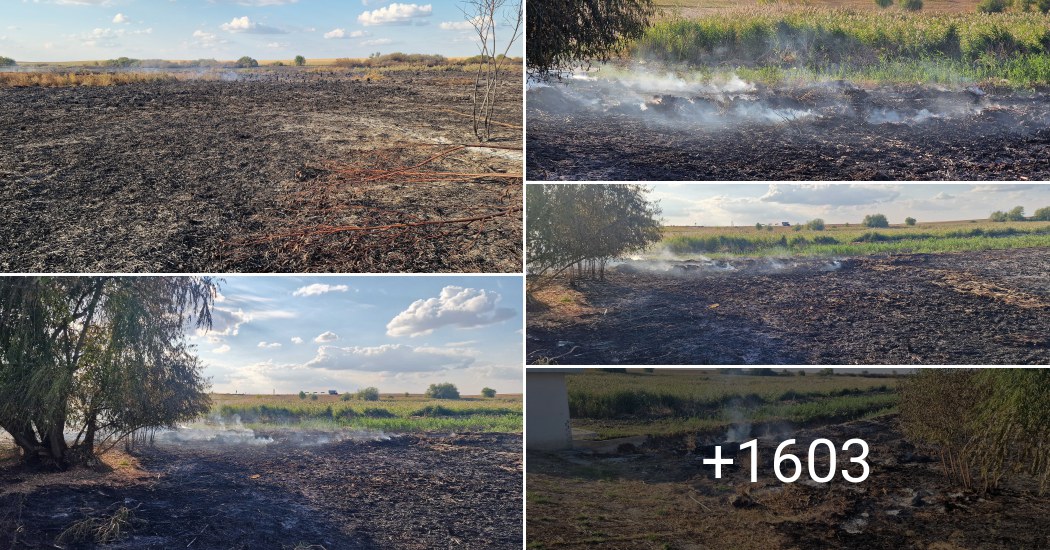
The landscape following the September 2026 fire.
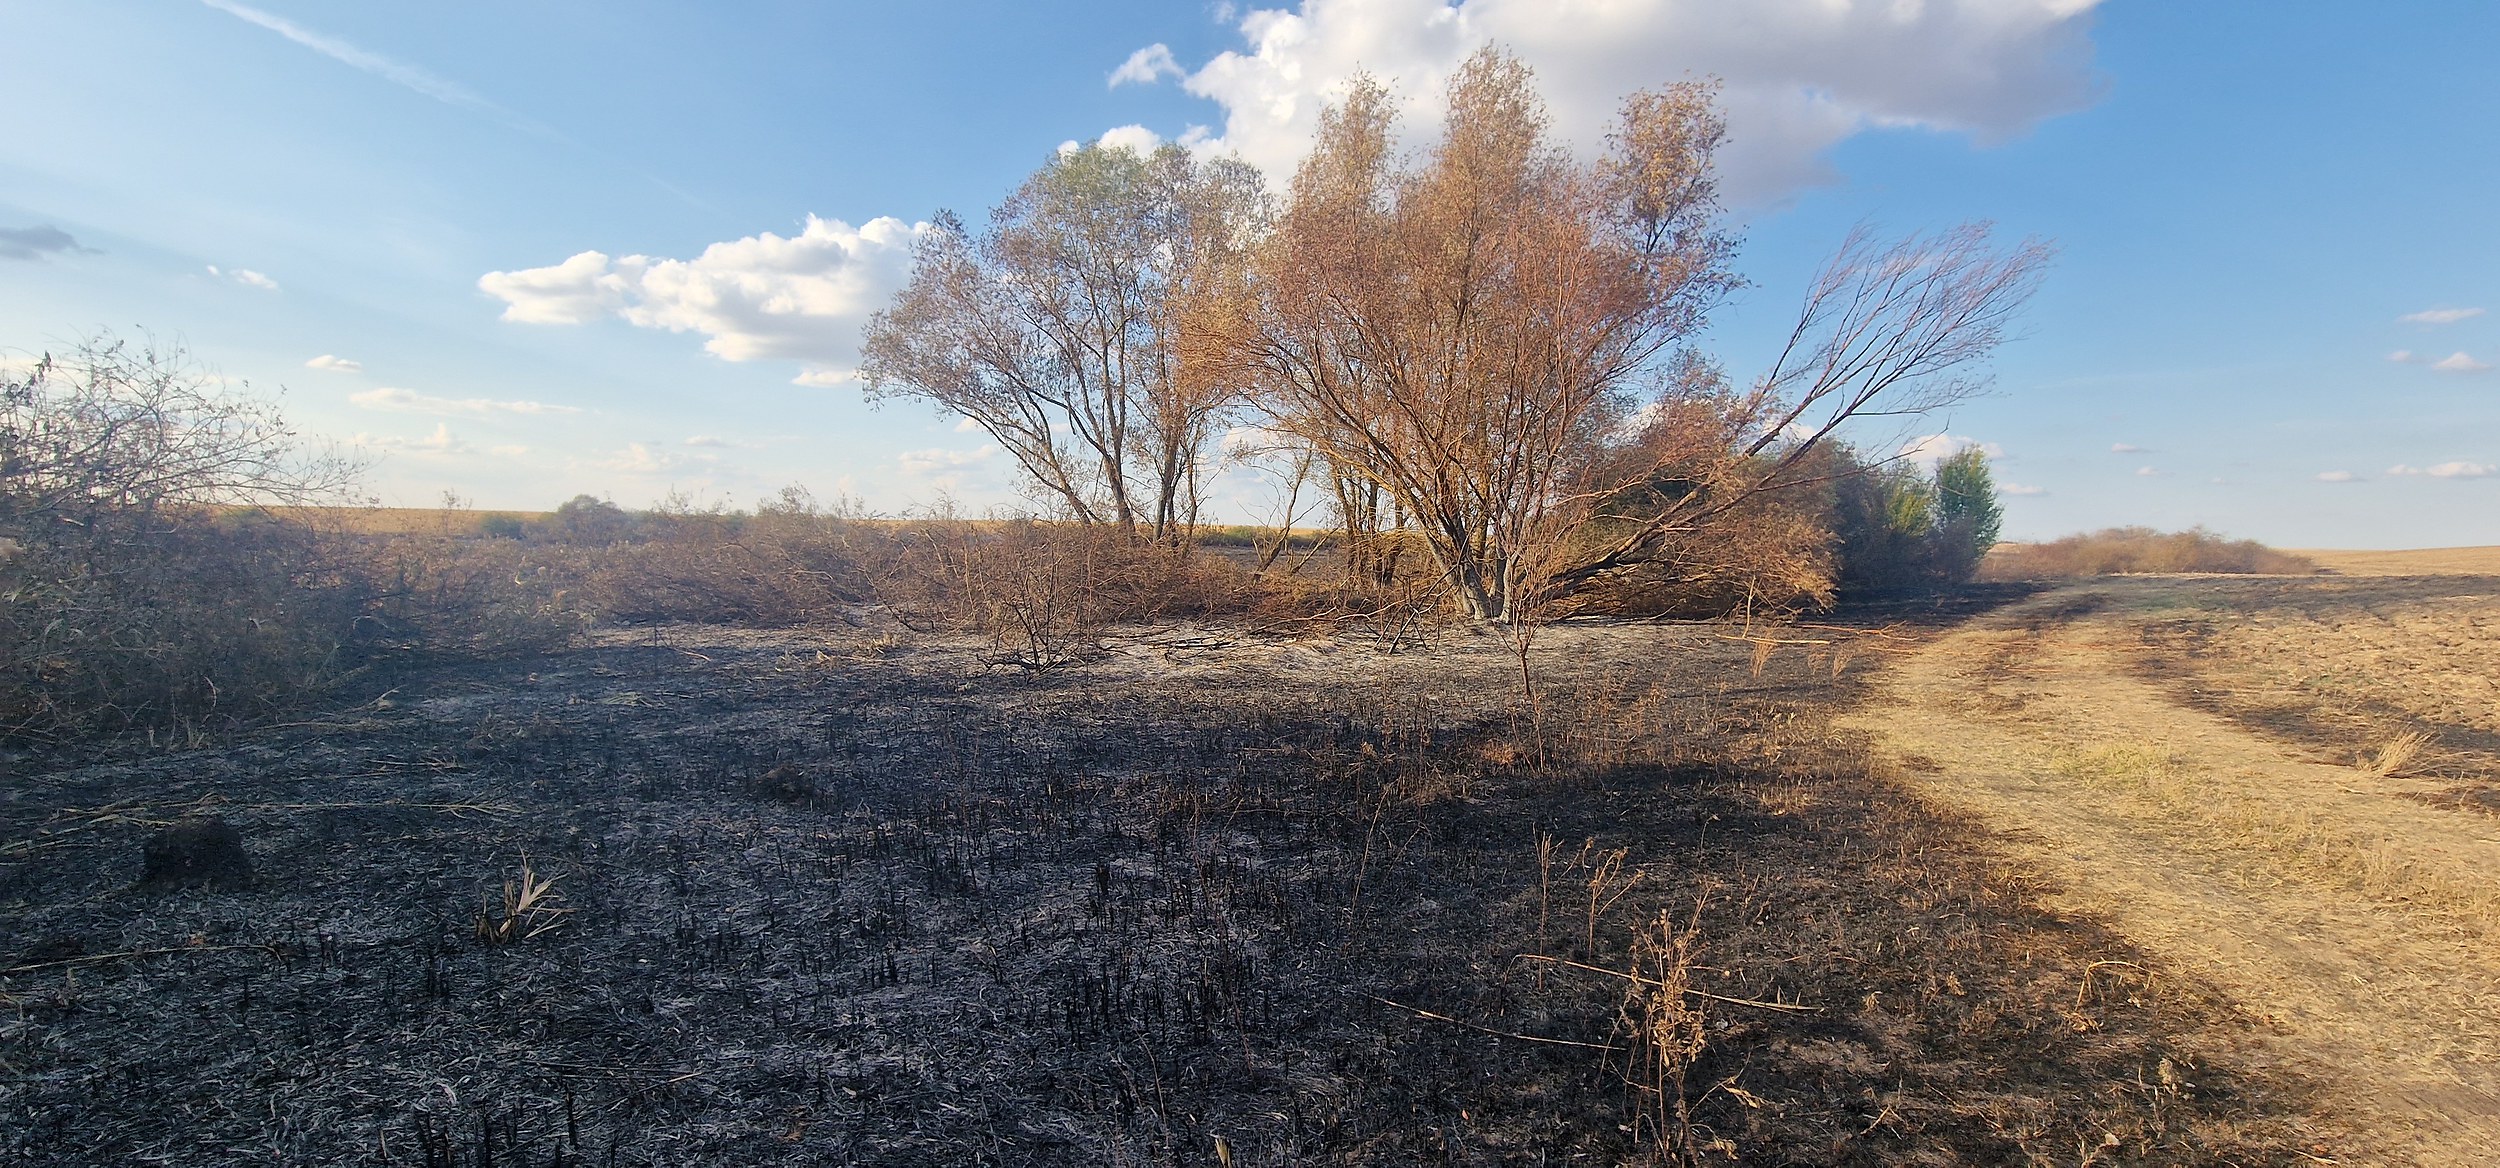
The landscape following the September 2026 fire.
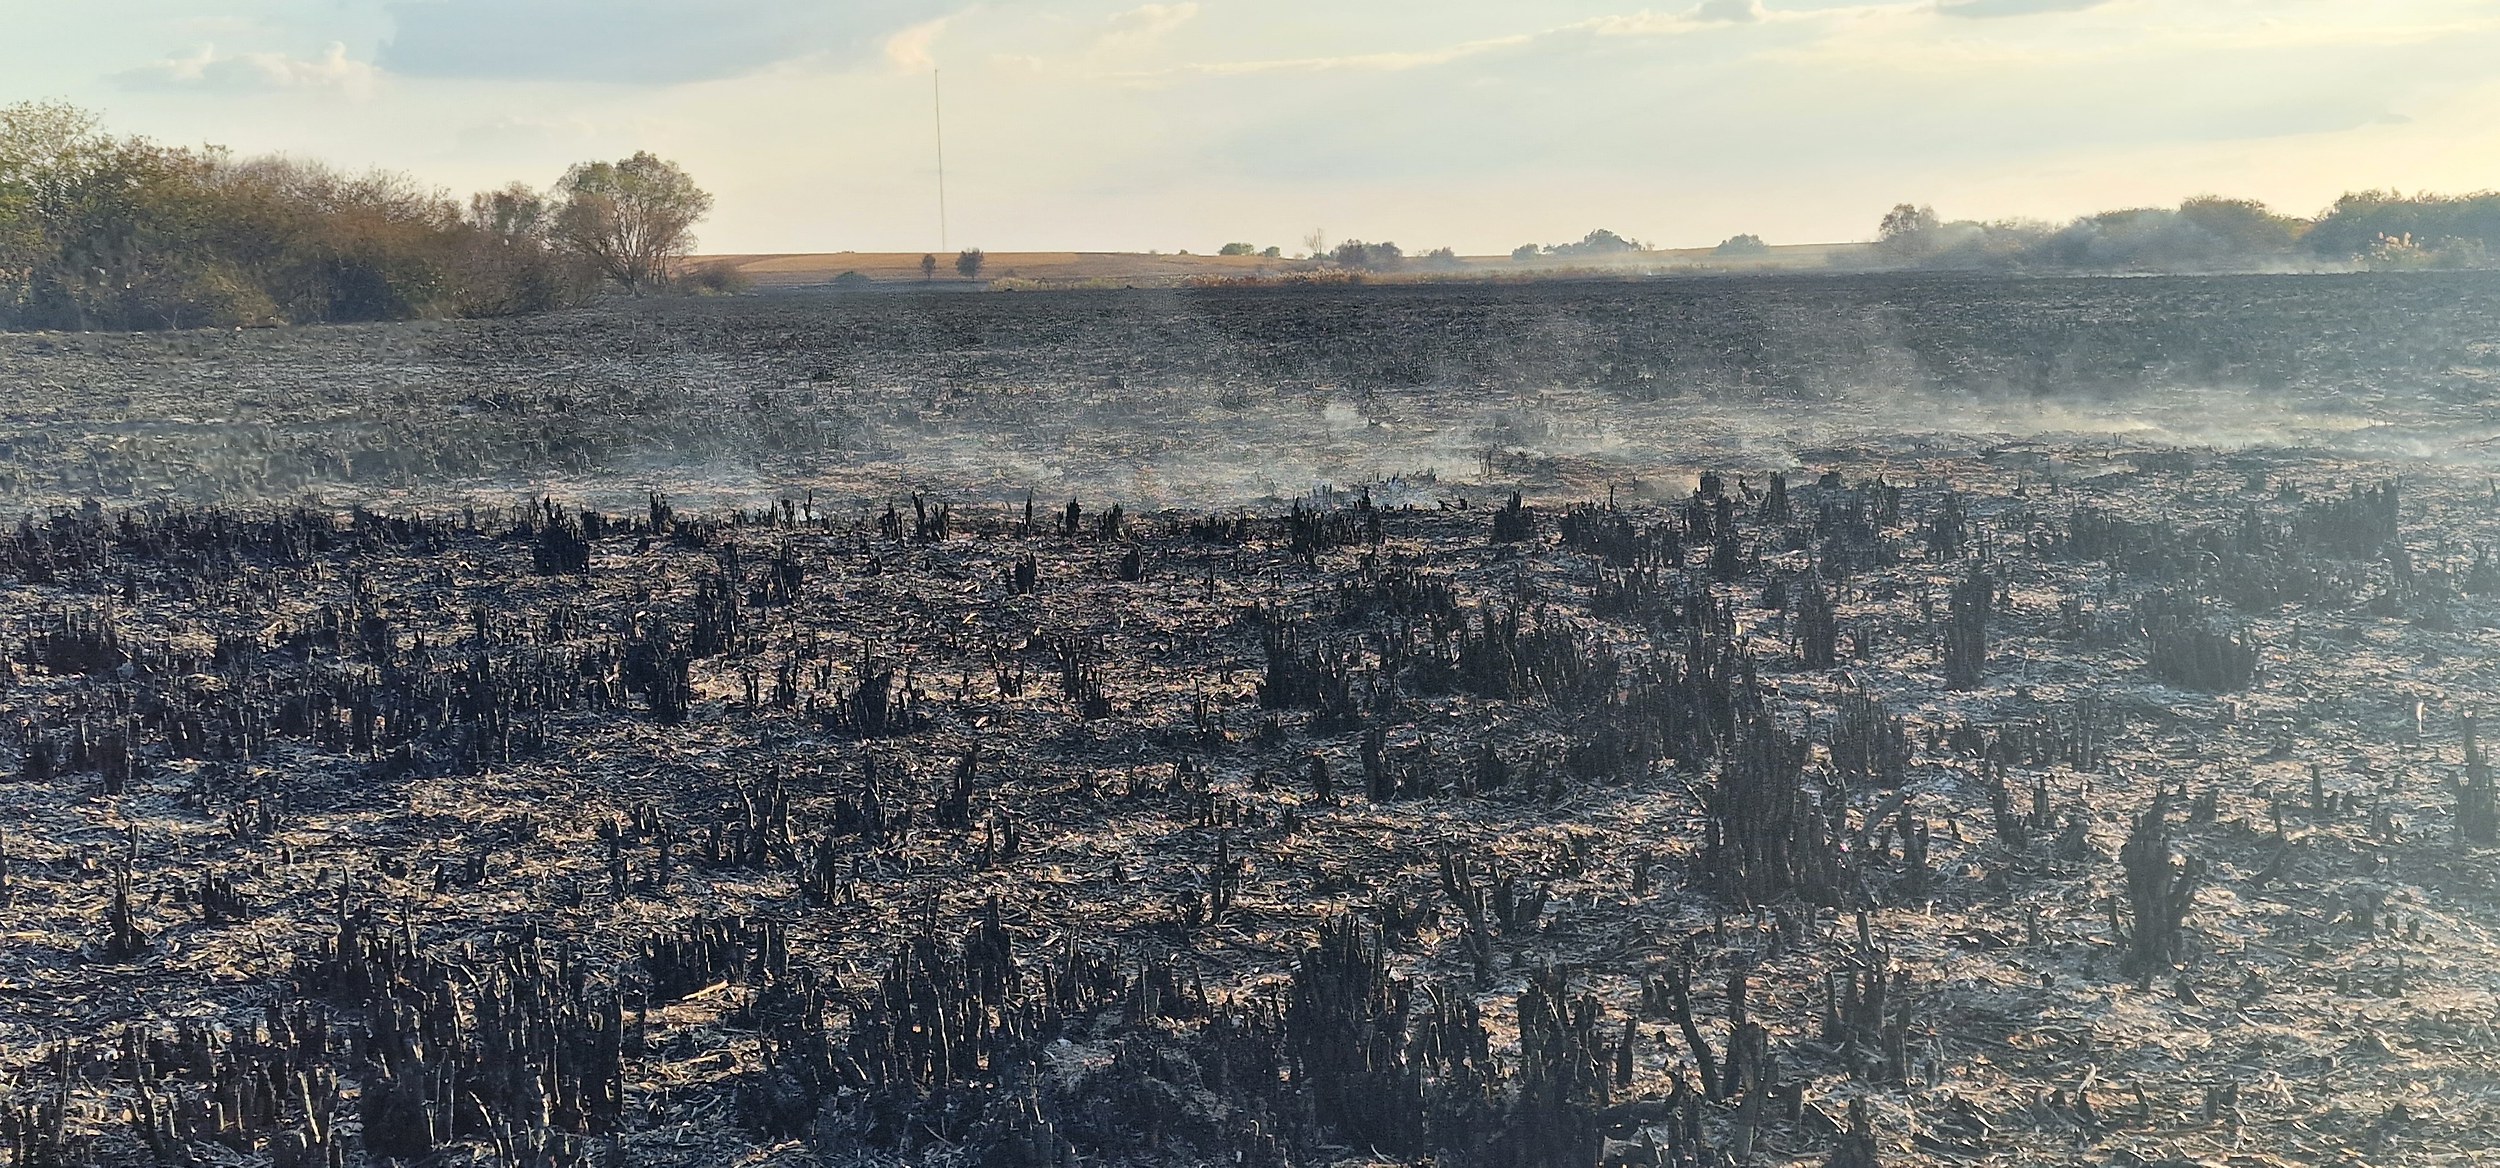
The landscape following the September 2026 fire.
Geographical Context
The fire occurred in the wetland landscape between Satchinez and Gelu, northwest of Timișoara. Overlaying the mapped fire perimeter with the official protected area boundaries shows that the affected area lies within the Natura 2000 site ROSCI0115 “Mlaștina Satchinez”.
However, ROSCI0115 is part of a broader ecological and legal conservation framework, together with ROSPA0078 “Mlaștina Satchinez” and the “Mlaștinile Satchinez” Nature Reserve (RONPA0757). ROSCI0115 protects saline grasslands and marshes, alluvial meadows, and floodplain vegetation, while ROSPA0078 focuses on the conservation of birds and the habitats on which they depend.
The fact that the flames did not reach the nature reserve itself (RONPA0757) or ROSPA0078 does not mean that the fire occurred outside a protected area. Legal boundaries may differ, but the ecosystem functions as an interconnected whole. Water, vegetation, wildlife, fire, and smoke do not stop at the boundaries of administrative designations.
The official management plan addresses ROSCI0115, ROSPA0078, and the “Mlaștinile Satchinez” Nature Reserve (RONPA0757) together, precisely because the condition of each component depends on the functioning of the landscape as a whole.
The fire occurred against the backdrop of the prolonged drought of 2026, officially described as severe in Timiș County. In the areas we surveyed within what was once known as the “Banat Delta”, surface water was entirely absent at the time of our observations, and the vegetation was extremely dry. These conditions made the habitats considerably more vulnerable to ignition and rapid fire spread, and likely contributed to the extent and intensity of the fire.
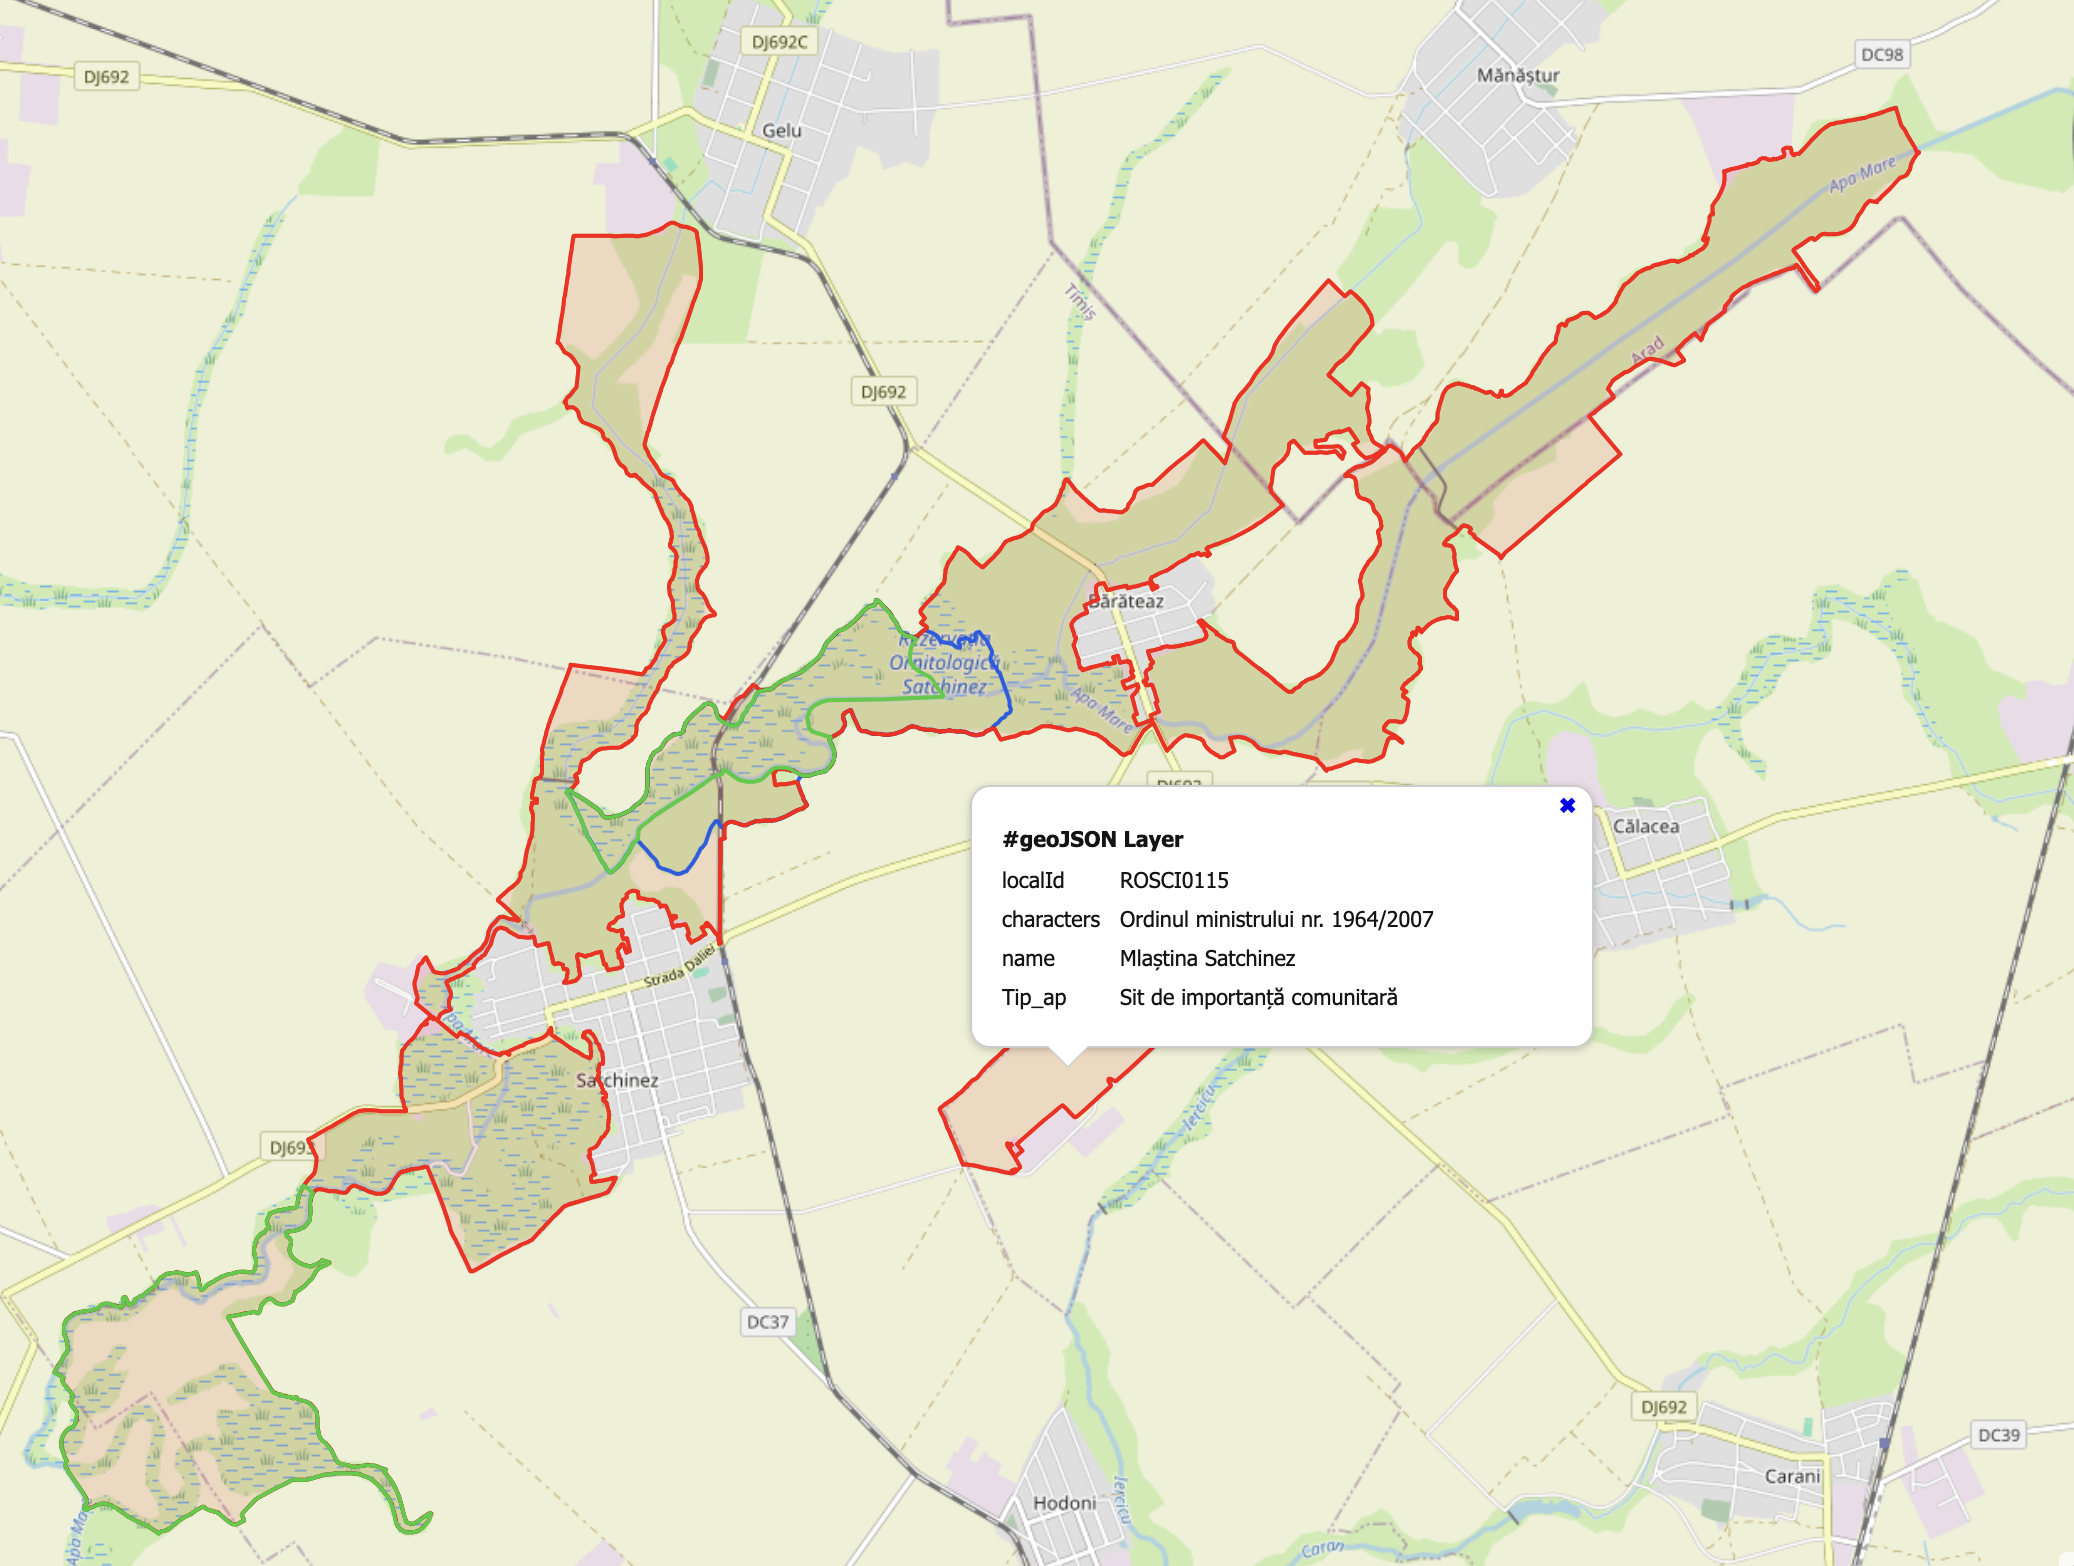
Official boundaries of the ROSCI0115 ‘Mlaștina Satchinez’ Natura 2000 site in relation to the surrounding settlements and wetlands. The map shows that the protected site covers a much larger area than the nature reserve itself.
Not an Isolated Event
The September fire was not the only recent event of its kind within the Natura 2000 site ROSCI0115.
In the winter of the same year, another substantial area was affected by fire. This area is located south of Satchinez, towards Biled, also within ROSCI0115. The site already showed clear signs of drying out and vegetation degradation, and the fire caused further damage to the habitat. Evidence of the fire has been documented through field observations and photographs.
The recurrence of large-scale fires within the Natura 2000 site raises concerns that go beyond each individual event. What matters is their frequency, the cumulative area affected, and how fire interacts with wetland desiccation, overgrazing, and vegetation loss.
An already degraded habitat may become more vulnerable to fire, while repeated fires can further undermine its capacity to recover.
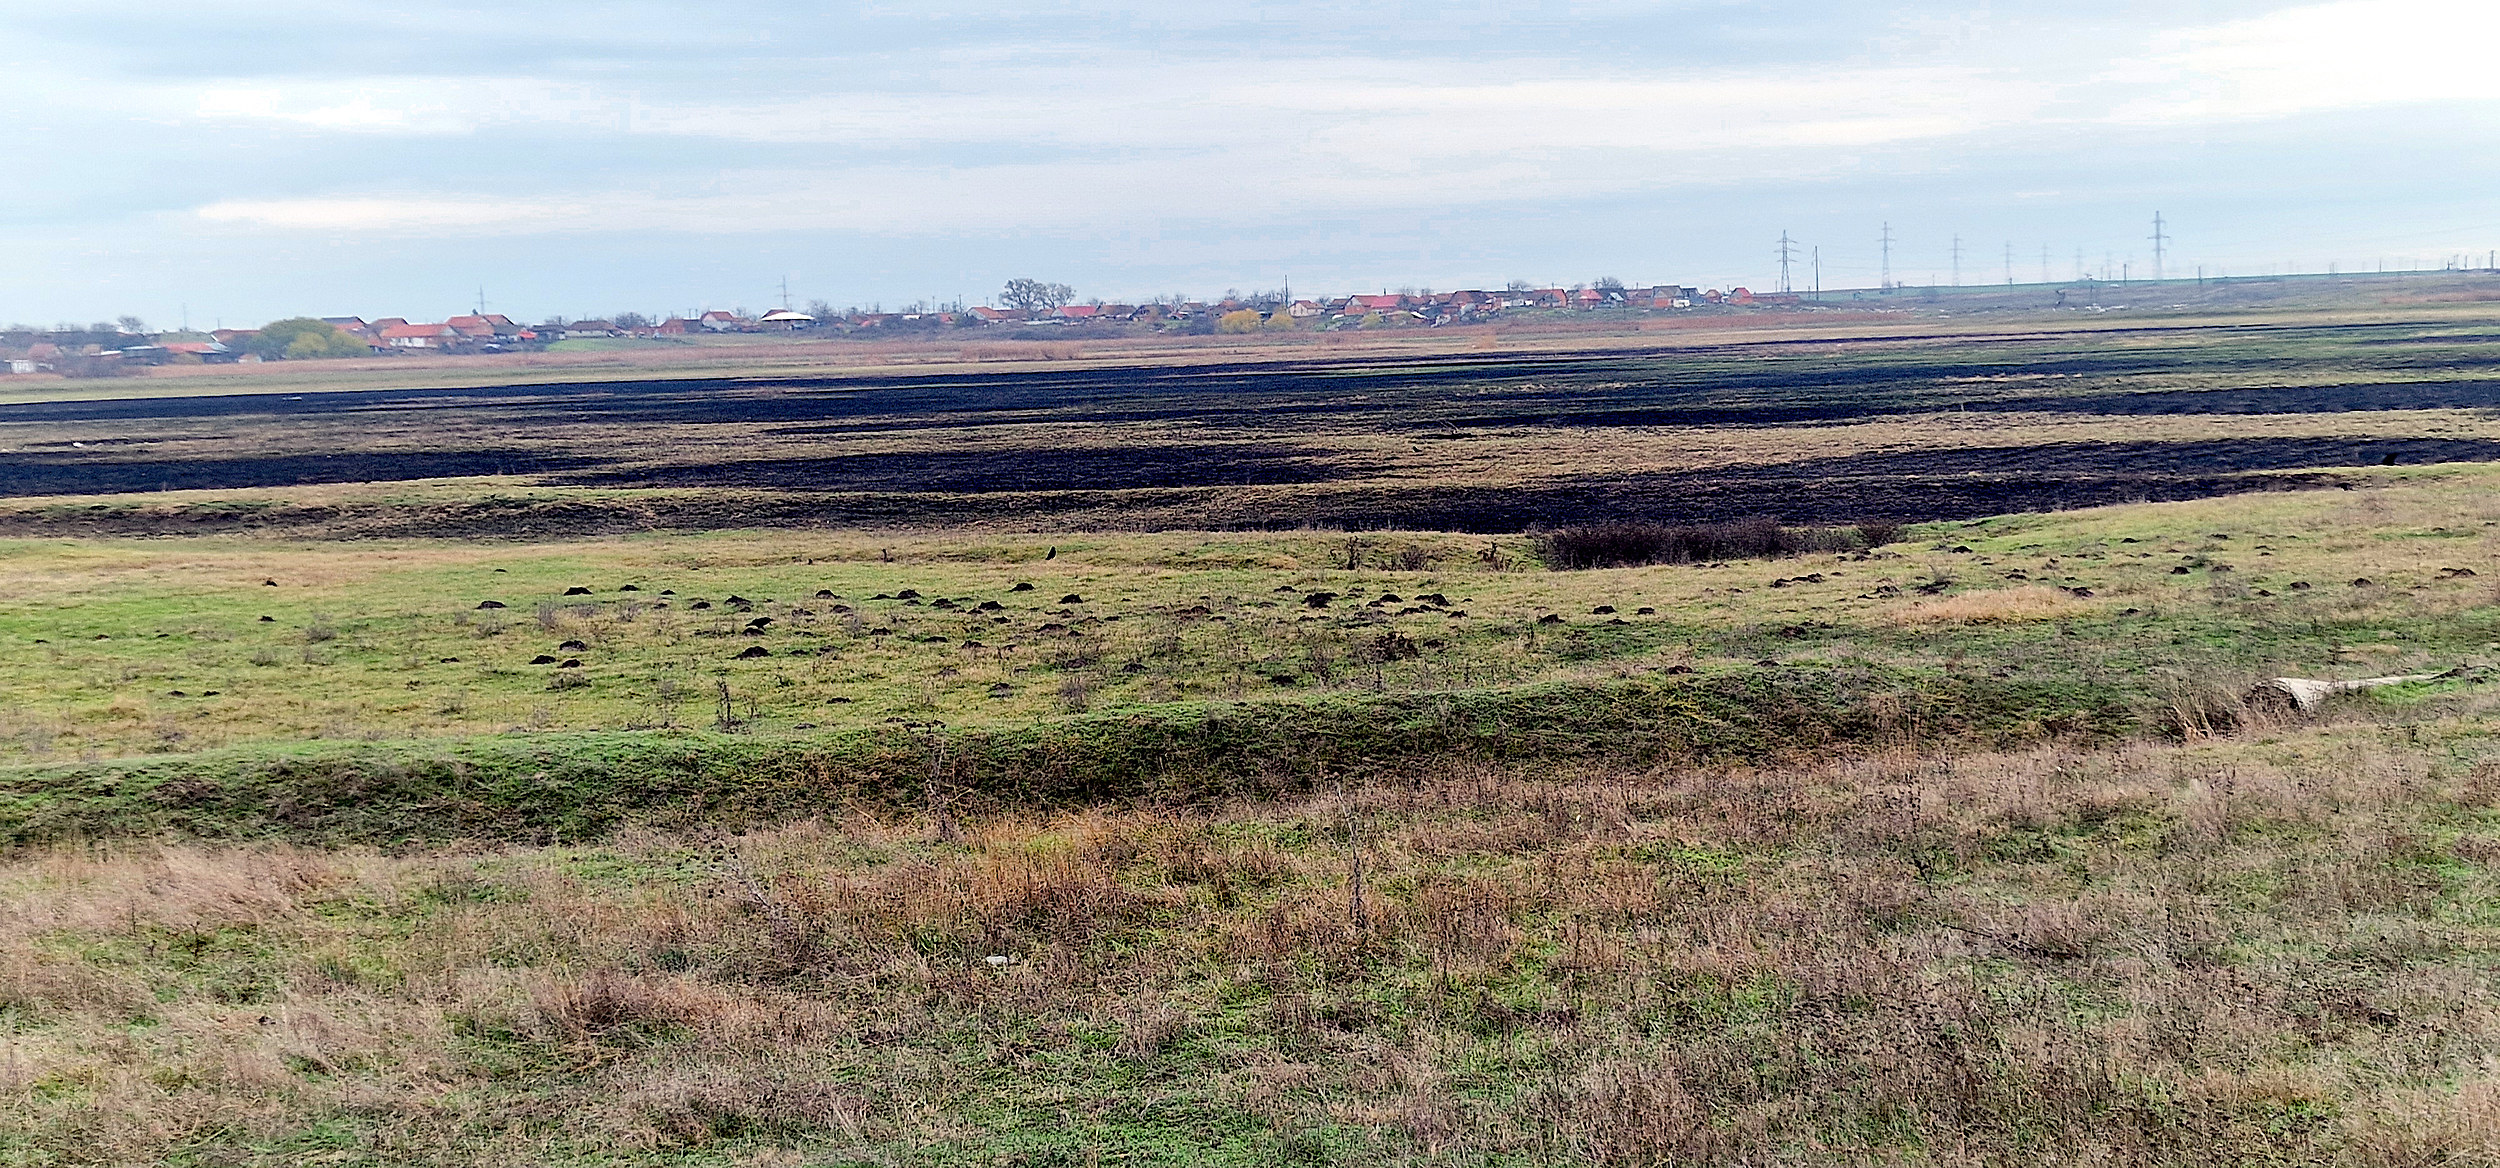
The landscape following the Winter 2026 fire (South West of Satchinez).
From Individual Measurements to a Landscape-Wide Picture
Sensors generate thousands of measurements. When viewed in a table, these values can be difficult to interpret. As part of the “Cross-border Cooperation Network for the Sustainable Use of Natural Resources – Green Path” (RORS00127) project, the sensorManager application organizes measurements collected by the distributed sensor network into successive time intervals and visualizes them on a map.
This allows us to examine:
- where increases in airborne particulate matter occur;
- how long they persist;
- how many sensors detect them;
- whether the phenomenon is localized or widespread;
- whether certain areas are more severely affected;
- how measured values change in relation to wind conditions;
- where deviations from normal patterns occur.
The sequence can be played back as an animation. Rather than simply displaying points and numbers, the map reveals how a phenomenon evolves over time: its emergence, spread, persistence, and eventual disappearance.
The fire perimeter can be drawn directly on the map and linked to the approximate time of the event. Meteorological data provide information on wind direction and speed. The application can then compare sensor measurements with the location of the burned area and the movement of air masses.
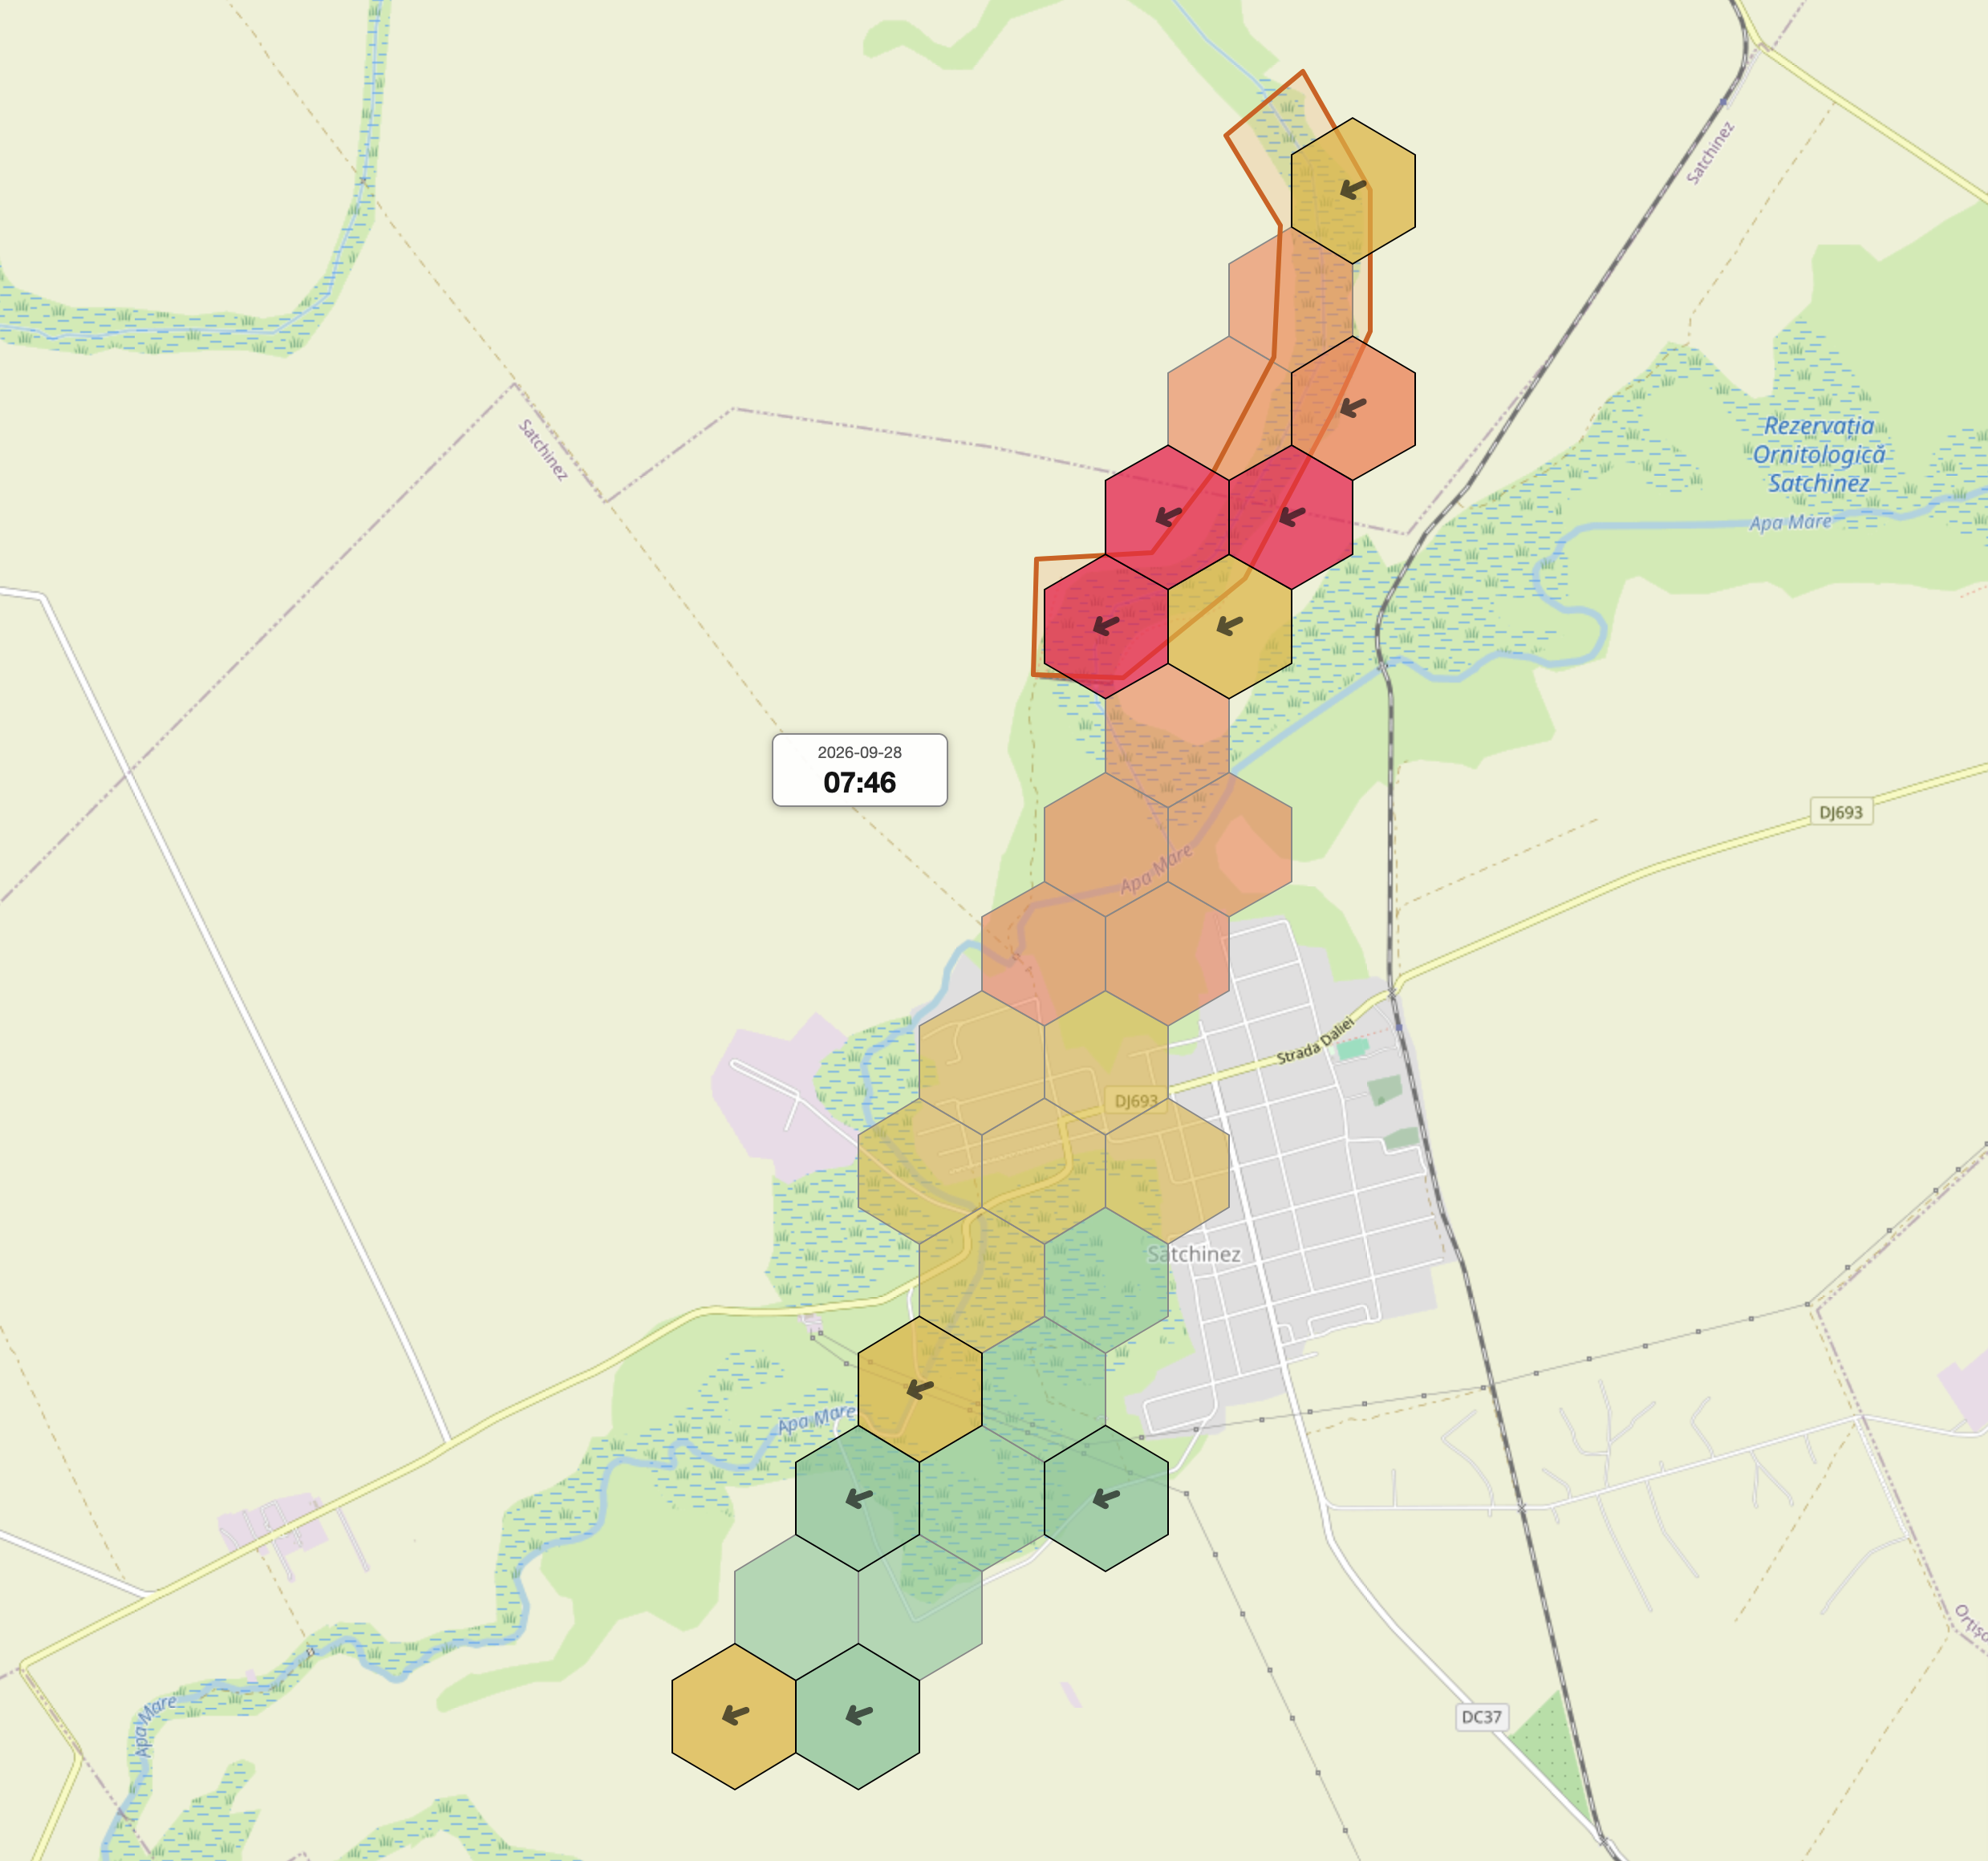
Spatial distribution of the Air Quality Score (AQS) around Satchinez on 28 September 2026 at 07:46. Warmer colours indicate poorer air quality, arrows show wind direction, and the orange outline marks the mapped fire perimeter.
Spatio-temporal evolution of air quality around the Satchinez fire. The animation reconstructs the successive distribution of AQS from network measurements and interpolated values, together with wind direction and the mapped fire perimeter. Each frame represents a one-hour window advanced in 30-minute steps.
What This Field Experiment Revealed
The analysis indicates that episodes of elevated particulate matter concentrations were recorded simultaneously at multiple locations. Some were widespread across the sensor network, while others affected only certain areas.
This is one of the most important findings of the experiment: air quality does not vary uniformly across the landscape.
There were periods of relatively stable conditions and periods marked by sharp increases in particulate matter concentrations. When the same signal appears simultaneously at numerous sensors, it provides evidence of a real atmospheric phenomenon detected at multiple locations.
The fire and our field observations provide a plausible context for some of these episodes. In certain locations, the ground was still smouldering after the main fire had subsided.
However, the measurements cannot automatically attribute all recorded values to a single source. Other fires, agricultural activities, traffic, windblown dust, or natural processes may also contribute to particulate matter concentrations in the region.
The sensor network cannot provide a definitive answer on its own. It offers a broader picture and helps us ask the right questions.
What We Measure and What We Hypothesize
This distinction is fundamental:
We must maintain a clear distinction between what we measure directly and what we propose as a hypothesis.
The sensors can show that particulate matter concentrations increased at multiple locations during a given period. They can describe the duration and spatial extent of the phenomenon, as well as its relationship with atmospheric conditions.
They can reveal a spatiotemporal pattern consistent with the fire and the prevailing wind direction.
However, the sensors alone cannot demonstrate that pesticides have degraded the soil, that a particular agricultural operation generated a dust cloud, or that an event caused a specific health effect. Such conclusions require additional information on soil conditions, vegetation, agricultural activities, public health, and satellite imagery.
Nevertheless, the network can help identify where and when further investigations would be most valuable.
Why Does It Matter If Fires and Dust Have Always Existed?
The fact that a phenomenon has occurred in the past does not make it any less important today.
Fires have happened before. Wind has always carried dust. Fields have been burned and cultivated for generations. The question today is whether the frequency, intensity, duration, and spatial extent of these phenomena are changing.
A landscape does not function in isolation from the changes taking place around it. Drought, rising temperatures, wetland desiccation, grassland degradation, vegetation loss, recurring fires, grazing, and agricultural activities can all interact and reinforce one another.
A cloud of dust may seem like an ordinary occurrence. But it may also indicate soil left exposed by the loss of vegetation cover, land cultivated during an exceptionally dry period, or the combined effects of multiple land-use activities.
We cannot simply assume that this hypothesis is true. We can, however, collect observations that allow us to investigate it.
The Ecological and Social Dimension
Air pollution is more than a series of measurements. It occurs within a landscape inhabited, cultivated, and transformed by people.
A fire affects vegetation, soil, wildlife, and the ecosystem's capacity to recover. Smoke and airborne particles can cross administrative boundaries and property lines. Activities carried out in one location may have observable effects far beyond it.
This is why a distributed sensor network can also serve a social purpose. It can preserve a record of past events, document the experiences of local communities, and create a connection between local observations and scientific investigation.
People often report smelling smoke, experiencing poor air quality, or noticing dust arriving from a particular direction. These accounts are important, but they can easily be forgotten. The sensor network can add a measurable dimension: when the phenomenon occurred, how long it lasted, where it was detected, and how widespread it was.
This, we believe, is where the real value lies: we do not claim that every sensor provides the absolute truth. Instead, we gradually build a verifiable picture of how human activities affect the landscape. The network does not deliver a verdict on its own, but it can make visible phenomena that might otherwise remain mere impressions, local accounts, or forgotten events.
What Questions Can We Ask?
Such a network allows us to move beyond general impressions and ask specific questions:
- Was the phenomenon local or regional?
- Which areas were affected, and for how long?
- Did the episodes move in the direction of the wind?
- Did areas closer to the fire show different responses?
- Did the signal persist after the fire had subsided?
- Did vegetation or topography provide any protection?
- Do similar episodes occur even in the absence of a fire?
- Is there a temporal relationship with other fires or agricultural activities?
- Are fires becoming more frequent in certain parts of the protected area?
- Where are more precise measurements needed?
- What additional information needs to be collected in the field?
The network cannot answer all these questions on its own. But it helps us formulate them in ways that make them possible to investigate.
Citizen Science and the Limitations of Low-Cost Sensors
Low-cost sensors cannot replace official monitoring stations. Their measurements can be influenced by humidity, temperature, sensor placement, airflow, and differences between individual devices.
These limitations do not make the data useless. Rather, they define how the data should be interpreted and used.
A highly accurate monitoring station can provide detailed measurements at a specific location. A network of low-cost sensors can monitor many locations simultaneously. The network can identify patterns and areas of interest, while reference-grade instruments and specialized analyses can subsequently be used to test the resulting hypotheses.
The two approaches complement each other.
This is the contribution of citizen science: more observation points, greater community participation, and the creation of a shared record of environmental changes across the landscape.
What Comes Next
This is not the end of the investigation. This monitoring campaign marks the beginning of our work in the Satchinez area. Similar campaigns will follow, involving a larger number of sensors deployed across a wider region. Repeated measurements will allow us to compare events, seasons, and landscape types, and to investigate whether the patterns identified locally also occur at a regional scale.
In the future, sensor measurements can be compared with satellite imagery, vegetation observations, land-use information, and monitoring campaigns conducted during other periods.
A single monitoring campaign can describe an event. Repeated campaigns can reveal whether a pattern is emerging.
Details on Methodology and Interpretation
How does the application turn measurements into a monitoring scenario?
The application groups measurements into regular time intervals and generates successive map frames. Each frame retains the measured values, sensor locations, and information required for visualization.
The map can display:
- measured values;
- increasing or decreasing trends;
- deviations from typical patterns;
- estimated values across areas between measurement points;
- wind direction and speed;
- the perimeter of the event under investigation.
Estimated values support visualization but are kept separate from actual measurements. They are not treated as independent observations in the statistical analysis.
The scenario is saved so that it can be replayed and reinterpreted without repeating all the calculations.
How is data quality checked?
The application checks for potential problems such as:
- periods when a measurement channel remains stuck at the same value;
- missing values and insufficient data coverage;
- unusual and persistent differences between devices;
- extreme episodes detected by only one sensor;
- episodes detected simultaneously by multiple sensors.
An exceptionally high value is not automatically classified as an error. If a similar increase is consistently detected by multiple sensors, it may represent a real phenomenon.
Devices with potential technical issues are flagged separately. The original data are neither deleted nor modified.
What do the correlations in the application mean?
The application compares particulate matter concentrations and other measured parameters with temperature, humidity, atmospheric pressure, and time of day.
A positive correlation indicates that two variables tend to increase together. A negative correlation indicates that one tends to increase as the other decreases. A correlation close to zero indicates that no simple, consistent relationship has been identified.
Pearson correlation primarily measures linear relationships and is more sensitive to extreme values.
Spearman correlation examines the ranking of values and is more tolerant of nonlinear relationships and extreme observations.
The time-of-day-adjusted analysis attempts to account for the normal day–night cycle. This helps determine whether a relationship persists beyond ordinary diurnal variations.
Correlation does not establish causation. It reveals an association that may help guide further investigation.
What can and cannot be concluded from AI-assisted interpretation?
AI-assisted interpretation synthesizes statistical results, spatial differences, detected episodes, and the context of the fire.
It can:
- identify patterns that deserve closer examination;
- compare different aspects of the analysis;
- highlight possible explanations consistent with the data;
- identify limitations and missing information;
- suggest further investigations.
It cannot turn an association into proof of causation, nor can it reliably identify the source of an episode based solely on these measurements.
Deterministic calculations, measured data, field observations, and AI-assisted interpretation remain distinct components. Any final conclusion must consider all of them without confusing their respective roles.
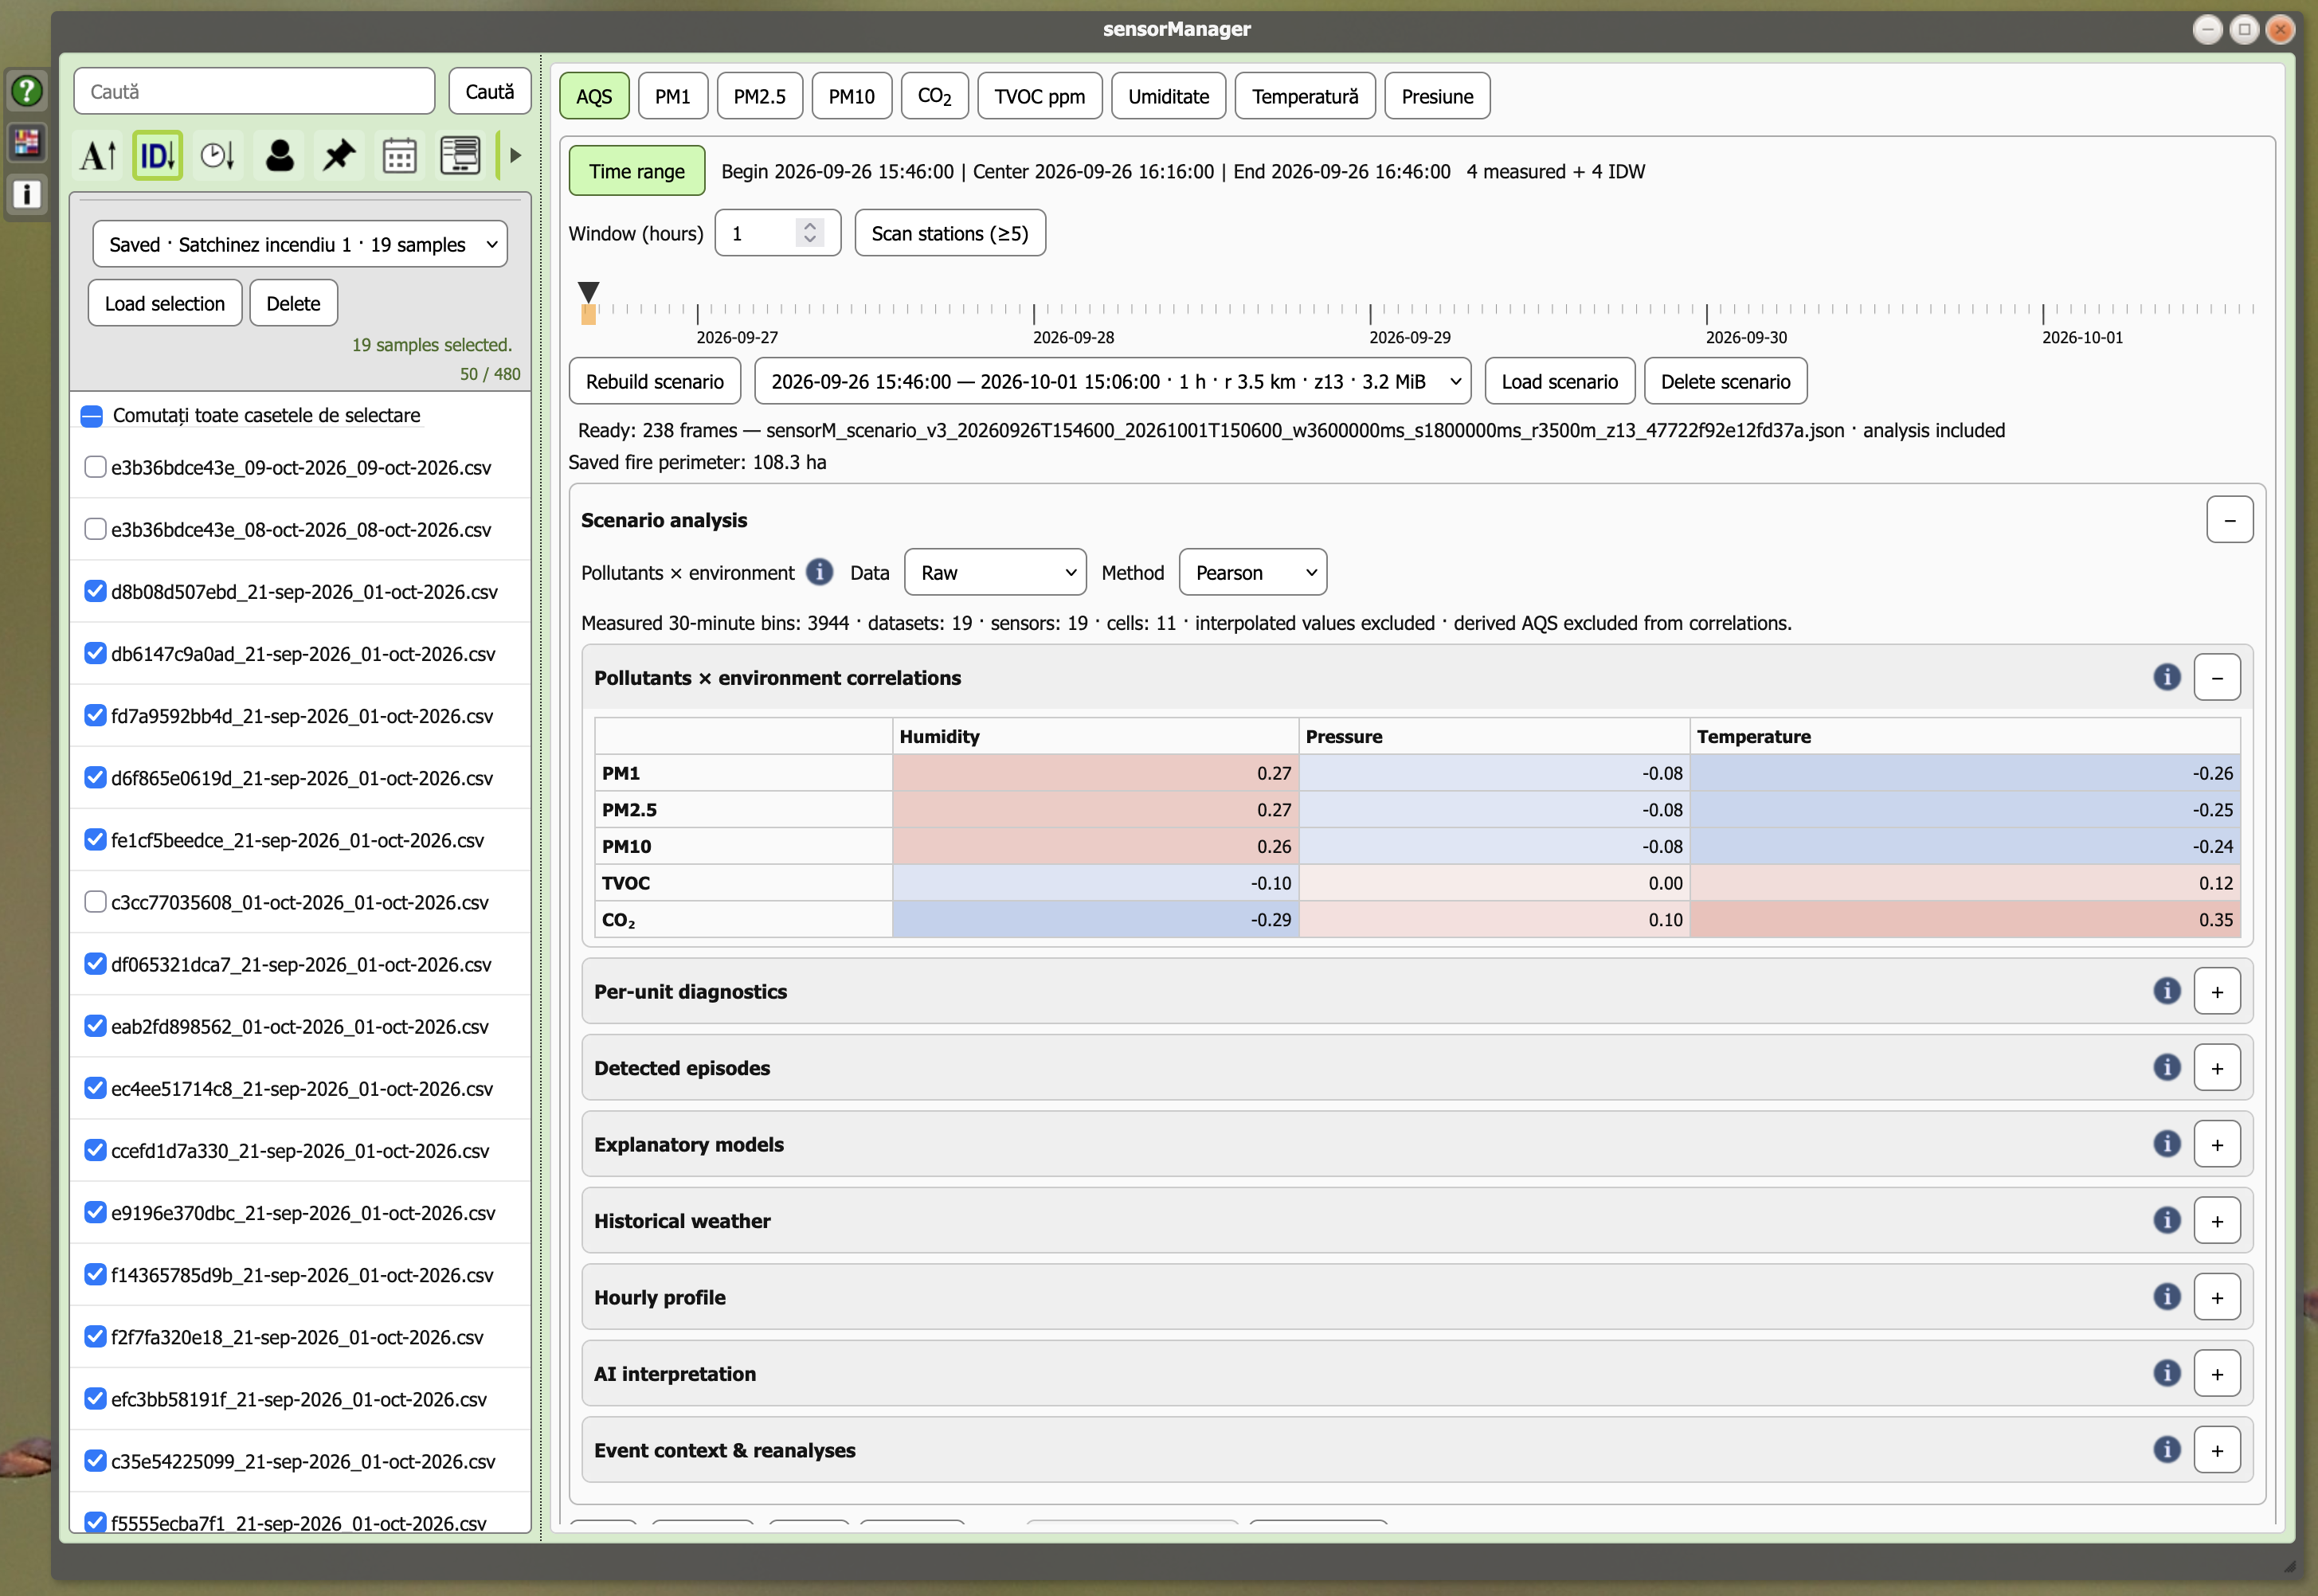
The scenario analysis interface in the sensorManager application: data from selected sensors are organized into a chronological sequence and analyzed through correlations with environmental factors, individual sensor diagnostics, detected episodes, meteorological data, and AI-assisted interpretation.
Project website: https://kladia.info/RORS/
Air Quality Monitoring System sensor results: https://kladia.info/RORS/sensors.php
This material was prepared within the project “CBC Network for Sustainable Use of Natural Resources” (RORS00127), implemented with financial support from the European Union through the Interreg IPA Romania–Serbia Programme 2021–2027.
The responsibility for the content of this material lies with the author(s). The content of this material does not necessarily represent the official position of the European Union.
The measurements presented in this article are indicative measurements obtained using portable sensors within a citizen-science monitoring network. They complement, but do not replace, official air-quality monitoring carried out using regulatory reference methods.